
Penerangan
Konsep "Kejuruteraan Terbalik"
Inovasi utama penunjuk ini terletak pada algoritma Kejuruteraan Terbalik. Biasanya, oscillator stokastik mengambil data harga dan menukarkannya menjadi nombor antara 0 dan 100. Penunjuk ini melakukan sebaliknya: ia mengambil tahap matematik oscillator dan memprojek semula mereka ke skala harga.
Ini membolehkan pedagang menterjemahkan momentum matematik kepada tahap harga konkrit ($ atau pips) secara langsung pada carta.
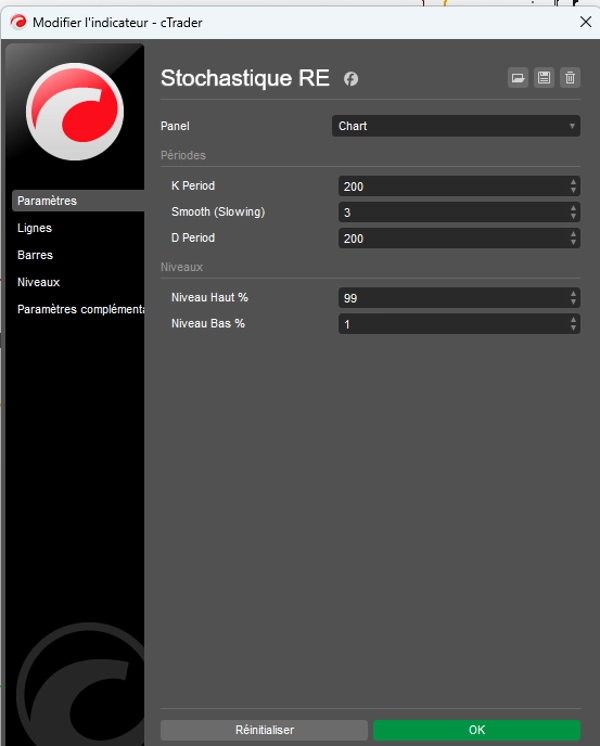
Menentukan Sempadan: Siling (99%) dan Lantai (1%)
Berbeza dengan tetapan klasik (80/20), penunjuk ini ditetapkan secara lalai kepada 1% dan 99%. Konfigurasi ini mempunyai tujuan khusus: ia menentukan had fizikal harga.
- Tahap 99% (Siling Harga): Ia menentukan harga tertinggi yang boleh dicapai pasaran sebelum dianggap telah menghabiskan 99% amplitud pergerakannya sepanjang tempoh yang diberikan. Ia adalah "sempadan" harga.
- Tahap 1% (Lantai Harga): Ia menentukan harga terendah, sokongan utama kitaran semasa. Ia adalah tahap di mana harga telah menghabiskan 99% kapasiti penurunannya berbanding sejarah terkininya.
Mengapa Ia "Menentukan Harga"?
Terima kasih kepada sistem ini, garisan Isyarat Jingga %D tidak lagi hanya lengkung yang bergerak dalam vakum.
- Lokalisasi Harga: Ia menunjukkan lokasi tepat "harga adil" yang diimbangi oleh momentumnya.
- Pemetaan Julat: Ia mengubah carta menjadi peta di mana anda boleh melihat sama ada harga semasa "bernilai" 1% atau 99% daripada potensinya.
- Sasaran Konkret: Jika garisan jingga bergerak naik, ia bukan sekadar mencari untuk mencapai "80"; ia mencari untuk mencapai harga tepat yang dipaparkan oleh garisan merah (99%).
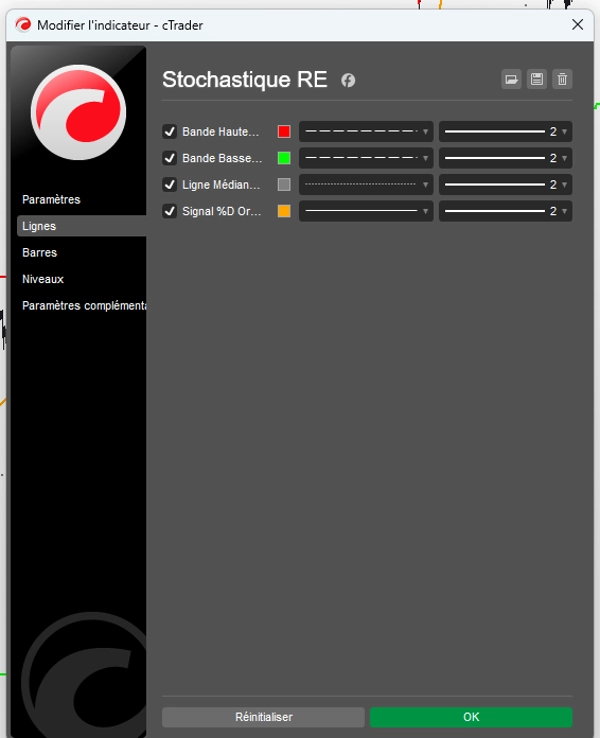
Fungsi Garisan (Tab Garisan)
Segalanya boleh disesuaikan untuk bacaan visual segera:
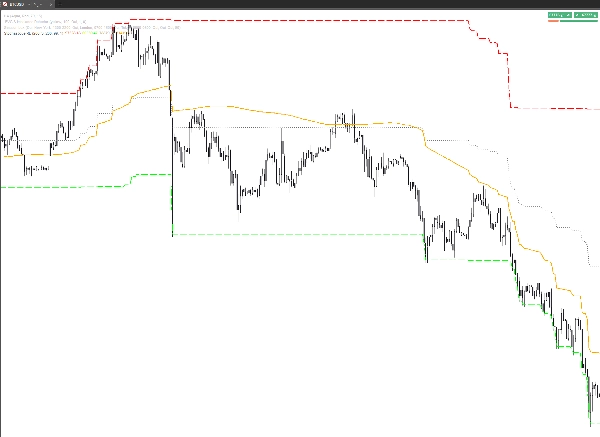
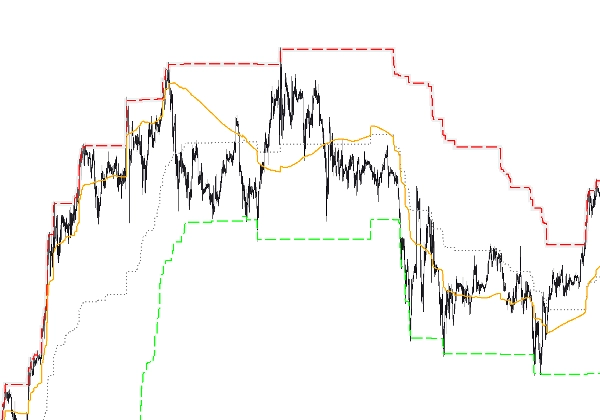
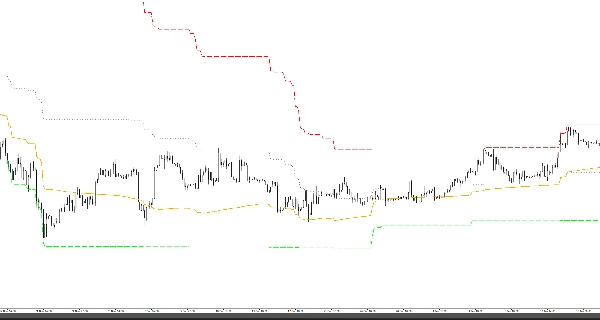
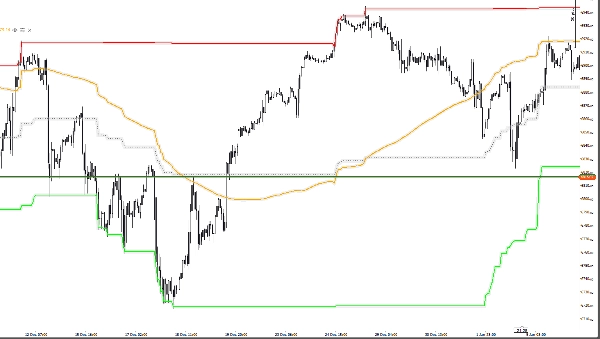
- Jalur Atas (99%): Siling harga teori.
- Jalur Bawah (1%): Lantai harga teori.
- Garisan Tengah (50%): Titik pivot pusat, zon keseimbangan.
- Isyarat Jingga %D: Kursor dinamik yang bergerak antara lantai dan siling untuk menentukan arah pasaran.
Ringkasan Pedagang
Penunjuk ini bukan sahaja memberitahu anda pasaran "terbeli berlebihan"; ia menunjukkan kepada anda pada harga tepat apabila pasaran menjadi terlalu mahal secara fizikal (99%) atau terlalu murah (1%). Ia adalah alat ketepatan yang mengembalikan matematik kepada realiti buku pesanan.
Ringkasan
The indicator displays these boundaries directly on the price chart, allowing traders to see exact price levels where the market is considered overbought or oversold. Key features include customizable lines for the upper band (99%), lower band (1%), mid line (50%), and an orange signal %D line that dynamically indicates market direction between these boundaries.
By translating momentum into precise price targets, Stochastique RE helps traders localize fair price zones, map price ranges, and identify concrete price targets rather than abstract oscillator values. It supports various markets including Forex, stocks, commodities, indices, and cryptocurrencies, with symbol tags such as BTCUSD, EURUSD, GBPUSD, XAUUSD, NAS100, and USDJPY.
Ulasan pelanggan
5 | 67 % | |
4 | 33 % | |
3 | 0 % | |
2 | 0 % | |
1 | 0 % |


