
RT Consolidation Zones
Indikator
1 pembelian
Versi 1.0, Sep 2024
Windows, Mac
Penerangan
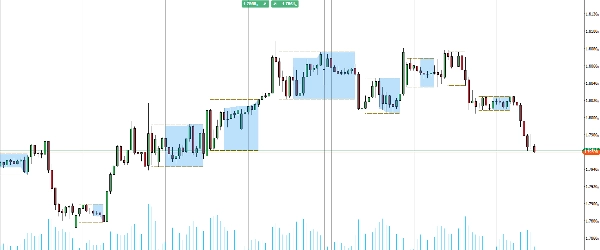
Memperkenalkan penunjuk Zon Konsolidasi, direka untuk membantu anda mengenal pasti dan memanfaatkan peluang pecahan dengan mudah.
Alat yang kuat ini menyerlahkan zon pada carta anda di mana harga sedang berkonsolidasi, menjadikannya mudah untuk mengesan titik pecahan yang berpotensi. Dengan memvisualisasikan kawasan kritikal ini, anda boleh menjangka pergerakan pasaran dengan lebih baik dan membuat keputusan perdagangan yang lebih bermaklumat.
Sesuai untuk pedagang yang ingin meningkatkan strategi mereka dengan pandangan yang jelas dan boleh dilaksanakan, naik taraf set alat perdagangan anda dan kuasai pecahan dengan penunjuk Zon Konsolidasi.
Ringkasan
Profil indikator
Ulasan pelanggan
0.0
Ulasan: 0
Ulasan pelanggan
Belum ada ulasan untuk produk ini. Anda sudah mencuba produk tersebut? Jadilah yang pertama untuk berkongsi pendapat anda!
Perbincangan
Soalan Lazim
BTCUSD
Forex
Breakout
Indices
EURUSD
Commodities
GBPUSD
NZDUSD
Prop
Crypto
Stocks
XAUUSD
NAS100
USDJPY
Produk yang tersedia melalui cTrader Store, termasuk bot dagangan, indikator dan plugin, disediakan oleh pembangun pihak ketiga dan diberikan akses untuk tujuan maklumat dan teknikal sahaja. cTrader Store bukan broker dan tidak memberikan nasihat pelaburan, syor peribadi atau sebarang jaminan prestasi masa hadapan.


Harga
Sejak 25/09/2024
20
Jualan