
FVG_tidypips
Indicatore
13 acquisti
Versione 1.0, Nov 2024
Windows, Mac
4.3
Recensioni: 3

Descrizione
Questo Indicatore Fair Value Gap (FVG) è uno strumento di analisi tecnica che aiuta i trader a identificare gli squilibri di prezzo.
Caratteristiche:
- Attiva/disattiva la visibilità dei gap rialzisti e/o ribassisti
- Mostra riquadri codificati a colori per una facile visualizzazione (predefinito: verde per rialzisti, rosso per ribassisti, oro per i livelli intermedi)
- Periodo di lookback regolabile per ridurre il disordine nel grafico
- Impostazione configurabile di estensione del riquadro (offset) per una migliore visualizzazione
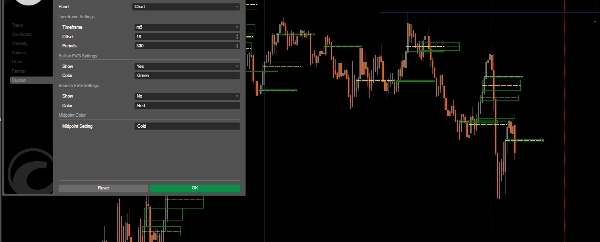
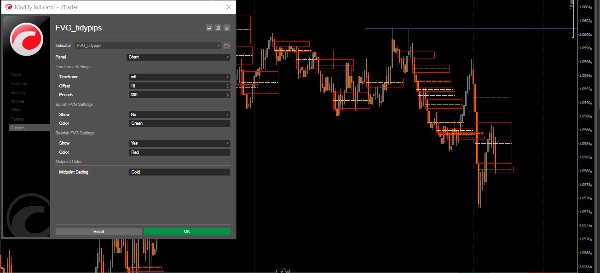
Parametri:
- Timeframe: Seleziona il timeframe preferito per visualizzare gli FVG
- Offset: Regola l'estensione orizzontale dei riquadri FVG (3-500)
- Periodi: Imposta il periodo di lookback per il calcolo storico degli FVG
- Mostra FVG Rialzisti/Ribassisti
- Colori: Personalizza i colori per gli FVG rialzisti, ribassisti e le linee intermedie
Applicazioni di Trading:
- Supporto e Resistenza: Gli FVG spesso agiscono come forti livelli di supporto/resistenza
- Magneti di Prezzo: I gap non colmati tendono ad attrarre l'azione del prezzo (DOL)
- Struttura di Mercato: Aiutano a identificare potenziali zone di inversione e punti di continuazione di interesse
- Analisi degli Order Block: Individua le zone di trading istituzionale
Migliori Pratiche di Applicazione:
- Usa in combinazione con altri strumenti di analisi tecnica.
- I timeframe più alti producono FVG più significativi, i timeframe più bassi usano gli FVG con il Bias Direzionale del timeframe più alto
- Monitora come il prezzo reagisce quando ritorna alle zone FVG
- Presta attenzione alla linea intermedia poiché spesso funge da magnete per il prezzo
Dai un'occhiata ad altri indicatori utili che ho pubblicato. Se trovi questo o uno qualsiasi dei miei altri indicatori utile, considera di supportare il mio lavoro acquistando o donando. Il tuo supporto non solo mi aiuta a continuare a sviluppare e migliorare questi strumenti, ma garantisce anche che io possa continuare a creare nuovi indicatori preziosi per migliorare la tua esperienza di trading. Grazie per il tuo continuo supporto!
https://buymeacoffee.com/tidypips
Riepilogo
Riepilogo AI
The FVG_tidypips indicator is a technical analysis tool designed to identify Fair Value Gaps (FVGs), which represent price imbalances on trading charts. It visually highlights bullish and bearish gaps using color-coded boxes—green for bullish, red for bearish, and gold for midpoint levels—facilitating quick recognition of potential support and resistance zones. Users can toggle the visibility of bullish and/or bearish gaps, adjust the lookback period to manage chart clutter, and configure the horizontal extension (offset) of the FVG boxes for clearer visualization.
Key parameters include selecting the timeframe for FVG display, setting the offset range (3–500), defining the lookback period for historical gap calculation, and customizing colors for different gap types and midpoint lines. The indicator supports trading applications such as identifying strong support/resistance levels, spotting price magnets where unfilled gaps attract price action, analyzing market structure for potential reversal or continuation zones, and detecting institutional order block areas.
Best practices recommend using this indicator alongside other technical tools, focusing on higher timeframes for more significant FVGs, and monitoring price reactions when revisiting FVG zones. The midpoint line is noted as an important price magnet. This tool is applicable across various markets, including commodities like gold (XAUUSD).
Profilo indicatore
Recensioni dei clienti
4.3
Recensioni: 3
5 | 33 % | |
4 | 67 % | |
3 | 0 % | |
2 | 0 % | |
1 | 0 % |
Recensioni dei clienti
November 22, 2024
Good idea with limits for traders who use ICT or SMC concepts. It gives value around smart money style analysis, but zones still need manual validation. A good sample is 20 FVG or order block reactions, with messy 0.705 areas skipped. The zone is more convincing when structure and risk both make sense.
November 21, 2024
November 21, 2024
Small but practical edge for smart money style analysis. it adds structure around liquidity, gaps and market shifts, especially when used for mapping zones before entries. For SMC logic, I trust zones more when 0.5 mitigation, BOS and liquidity sweep line up. The zone is more convincing when structure and risk both make sense.
Discussioni
Domande frequenti
Commodities
XAUUSD
I prodotti disponibili tramite cTrader Store, inclusi bot di trading, indicatori e plugin, sono forniti da sviluppatori terzi e resi disponibili esclusivamente a scopo informativo e di accesso tecnico. cTrader Store non è un broker e non fornisce consulenze in materia di investimento, raccomandazioni individualizzate o garanzie di risultati futuri.
Altro da questo autore


Prezzo
15
Vendite
4.62K
Installazioni gratuite