
MACD Histogram PRO
อินดิเคเตอร์
4 การซื้อ
เวอร์ชัน 1.0, Oct 2025
Windows, Mac
4.5
รีวิว: 2
คำอธิบาย
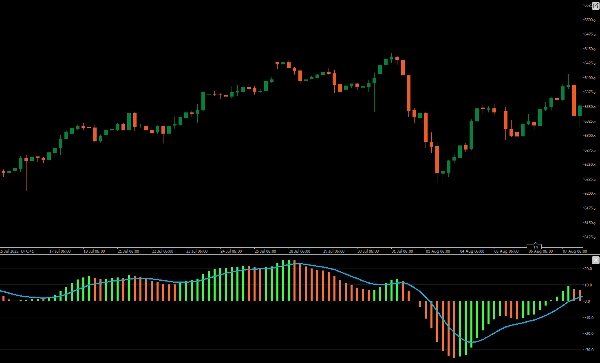
แนะนำ MACD Histogram ที่ได้รับการปรับปรุง เพื่อมอบประสบการณ์การเทรดที่ชัดเจนและลึกซึ้งยิ่งขึ้น
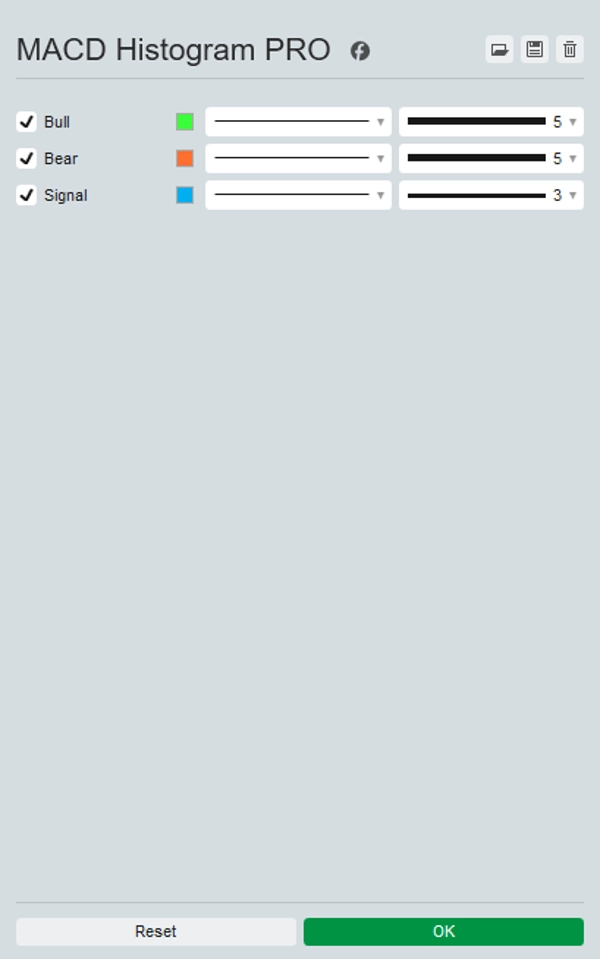
อินดิเคเตอร์ที่อัปเกรดนี้แสดงฮิสโตแกรมสีสันสดใสที่แยกความแตกต่างระหว่างการเปลี่ยนแปลงราคาขาขึ้นและขาลง ซึ่งเกินกว่ารูปแบบสีเดียวเริ่มต้น ด้วยการใช้สีที่แตกต่างกันสำหรับการเคลื่อนไหวในเชิงบวกและลบ มันให้สัญญาณภาพที่ชัดเจนทันทีเกี่ยวกับสภาพตลาด ทำให้ง่ายต่อการตีความการเปลี่ยนแปลงโมเมนตัมและการกลับตัวของแนวโน้มที่อาจเกิดขึ้น
เหมาะสำหรับเทรดเดอร์ที่ต้องการความชัดเจนและความแม่นยำที่เพิ่มขึ้น MACD Histogram การอัปเกรดนี้เปลี่ยนแผนภูมิของคุณให้กลายเป็นเครื่องมือวิเคราะห์ที่ทรงพลังยิ่งขึ้น ยกระดับกลยุทธ์การเทรดของคุณด้วย MACD Histogram ที่ได้รับการปรับปรุง
สรุป
สรุปโดย AI
MACD Histogram PRO is an enhanced technical indicator designed to improve the visualization of the traditional MACD histogram. It displays a vibrant, color-coded histogram that clearly differentiates bullish and bearish price movements, providing immediate visual cues on market momentum and potential trend reversals. This indicator supports analysis across various markets and symbols including Forex (EURUSD, GBPUSD, NZDUSD, USDJPY), cryptocurrencies (BTCUSD, crypto), commodities (XAUUSD, gold, oil, silver), indices (NAS100, SP500, DAX, Dow), and stocks. By using distinct colors for positive and negative momentum shifts, it aids traders in interpreting market conditions with greater clarity and precision. The MACD Histogram PRO is suitable for strategies involving signals and scalping, enhancing chart analysis for more informed trading decisions.
โปรไฟล์อินดิเคเตอร์
รีวิวจากลูกค้า
4.5
รีวิว: 2
5 | 50 % | |
4 | 50 % | |
3 | 0 % | |
2 | 0 % | |
1 | 0 % |
รีวิวจากลูกค้า
October 22, 2025
the only reason it stays interesting is one quick look should not become the only input, and 1.5R target is the line to watch.
October 17, 2025
การสนทนา
คำถามที่พบบ่อย
BTCUSD
Forex
Signal
Indices
EURUSD
Commodities
GBPUSD
NZDUSD
Prop
Scalping
Crypto
Stocks
XAUUSD
NAS100
MACD
USDJPY
ผลิตภัณฑ์ที่มีให้บริการผ่าน cTrader Store รวมถึงบอทการเทรด อินดิเคเตอร์ และปลั๊กอิน มีให้บริการโดยนักพัฒนาบุคคลที่สามและมีไว้เพื่อวัตถุประสงค์ในการเข้าถึงข้อมูลและทางเทคนิคเท่านั้น cTrader Store ไม่ใช่โบรกเกอร์และไม่ได้ให้คำแนะนำการลงทุน คำแนะนำส่วนบุคคล หรือการรับประกันผลการดำเนินงานในอนาคต


ราคา
ตั้งแต่ 25/09/2025
25
การขาย
316
ติดตั้งฟรี