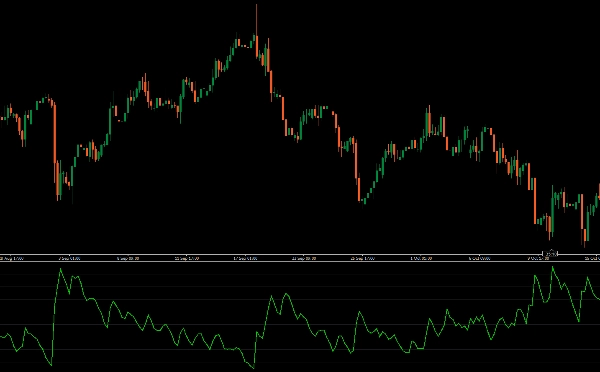
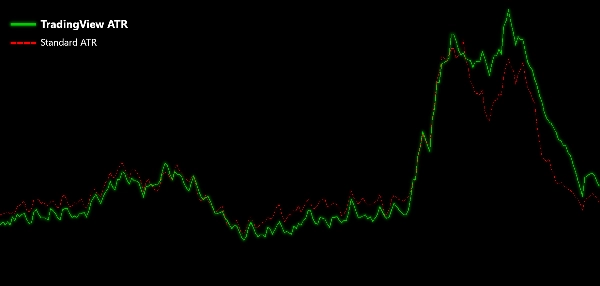
"TradingView ATR" 로고
TradingView ATR
"TradingView ATR" 업로드된 이미지
가입일 25/09/2025
21
판매
180
무료 설치

Introducing the TradingView ATR indicator for cTrader, designed to match the precision of TradingView’s Average True Range calculation.

This enhanced ATR uses a Relative Moving Average (RMA) for its calculations, providing a more accurate reflection of market volatility compared to the default ATR in cTrader. By incorporating the RMA, this indicator offers smoother and more responsive volatility readings, helping you make better-informed trading decisions.

Perfect for traders seeking improved accuracy in their technical analysis, this ATR indicator is a powerful tool to elevate your trading strategy.

Upgrade your cTrader toolkit with this ATR indicator for precise and reliable volatility insights.

Indicator profile
0.0
리뷰: 0
고객 리뷰
이 상품에 대한 리뷰가 아직 없습니다. 이미 사용해 보셨나요? 다른 사람들에게 가장 먼저 소개해 주세요!
BTCUSD
Forex
Indices
EURUSD
Commodities
GBPUSD
NZDUSD
Prop
ATR
Crypto
Stocks
XAUUSD
NAS100
USDJPY
Products available through cTrader Store, including trading bots, indicators and plugins, are provided by third-party developers and made available for informational and technical access purposes only. cTrader Store is not a broker and does not provide investment advice, personal recommendations or any guarantee of future performance.

이 작성자의 상품 더 보기

Professional execution engine for the Visual Risk Terminal. Instant batch orders, PnL syncing, and automated hedging.
1
손익비
0%
최대 낙폭
Optimize exits with Chandelier Exit! Visualize stop-loss points dynamically for improved trading precision and safety.
Enhance trading with ATR Bands! Visualize market volatility using dynamic upper and lower ATR bands for precise decision
Enhance MACD Histogram! Visualize bull and bear price changes with vibrant colors for clearer, more insightful trading.
Unlock trading precision with QQE! Dual QQE indicators with a Bollinger Bands zero line provide clear buy/sell signals.
Customize the MACD! Choose colors, get real-time tick updates, and see crossover points for enhanced trading precision.
Identify and trade breakouts with Consolidation Zones! Visualize price consolidation areas for trading opportunities.
Visual risk management terminal for cTrader. Set Lot size, SL, and TP via chart lines with real-time PnL projections.
Customize your Moving Average! Choose any timeframe and price source for precision and flexibility in your analysis.
Visualize trends with Standard Deviation Channel! Display median, and add customizable upper/lower deviation channels.
Unlock Stochastic RSI PRO in cTrader! Overlay RSI, highlight zones, and identify divergences with customizable settings.
Advanced MACD & Supertrend bot. Professional trend-following logic with ATR risk management and active profit-taking.
18%
1.82
손익비
20.05%
최대 낙폭

좋아하실 만한 다른 항목

Heikin Ashi (Heiken Ashi) - This indicator displays Heikin Ashi candles.
Sharp Rate Indikator
The Renko Moving Average Cross indicator combines classic EMA crossover signals with Renko-filtered prices.
Clustering tool for traders with visual insights into market patterns.
Wave Weis Bar Force - is an indicator that applies the logic of Volume waves (Weis) to determine accumulation
VWAP only timeframe
Macro Matrix: Sync high-order market flows with your current chart. Decode trend hierarchy and macro structure.
Stochastic RSI Indicator
Breakout Channels automatically detects consolidation ranges and highlights when price breaks out of them.
This indicator works best as a trend-confirmation tool—wait for multiple signals!
Tick Runs Bars extends market microstructure analysis by detecting directional persistence in trading flow.
MARainbow gives you the edge with four customizable moving averages—each color-coded for instant recognition.
Anchored VWAP Buttons
Custom VWAP Indicator for cTrader
CRTIndicator
It draws Pivot Levels on the chart.
Trend Is Your Friend cBot - INDICATOR - Professional Grid, Pyramid, Swing & Scalp Trading Indicator
Advanced Trend Detection & Visualization System
가입일 25/09/2025
21
판매
180
무료 설치