
Descrizione dell'indicatore:
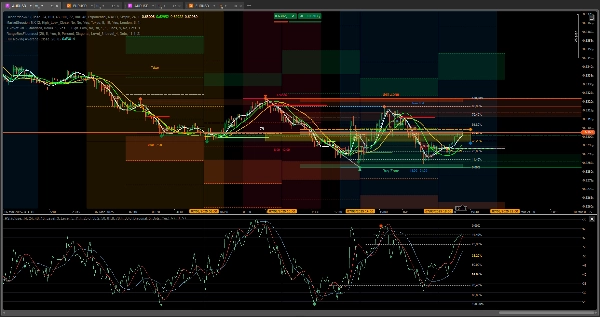
🎯 Indicatore RSI con Livelli di Fibonacci e Medie Mobili Hull 🚀
Vuoi portare la tua analisi tecnica al livello successivo? Questo indicatore è per te! Combina il meglio di tre potenti strumenti: il RSI (Relative Strength Index), Livelli di Fibonacci, e Medie Mobili Hull per offrirti una visione completa e precisa del mercato.
Caratteristiche principali:
- RSI con Livelli di Fibonacci:
-
- Identifica zone chiave di supporto e resistenza basate sui livelli di Fibonacci.
- Aiuta a rilevare potenziali inversioni e continuazioni con maggiore precisione.
- Medie Mobili Hull:
-
- Include due Medie Mobili Hull (Hull A e Hull B) per filtrare il rumore di mercato e catturare le tendenze in modo più efficiente.
- Fornisce segnali chiari di entrata e uscita basati su incroci e cambi di direzione.
- Zone di Cambiamento di Tendenza:
-
- Evidenzia aree critiche dove è probabile che si verifichino cambiamenti di tendenza, aiutandoti ad anticipare movimenti significativi.
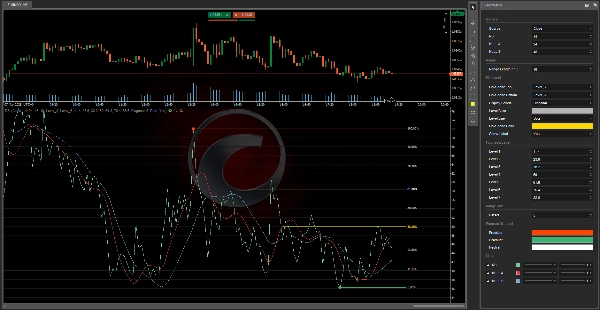
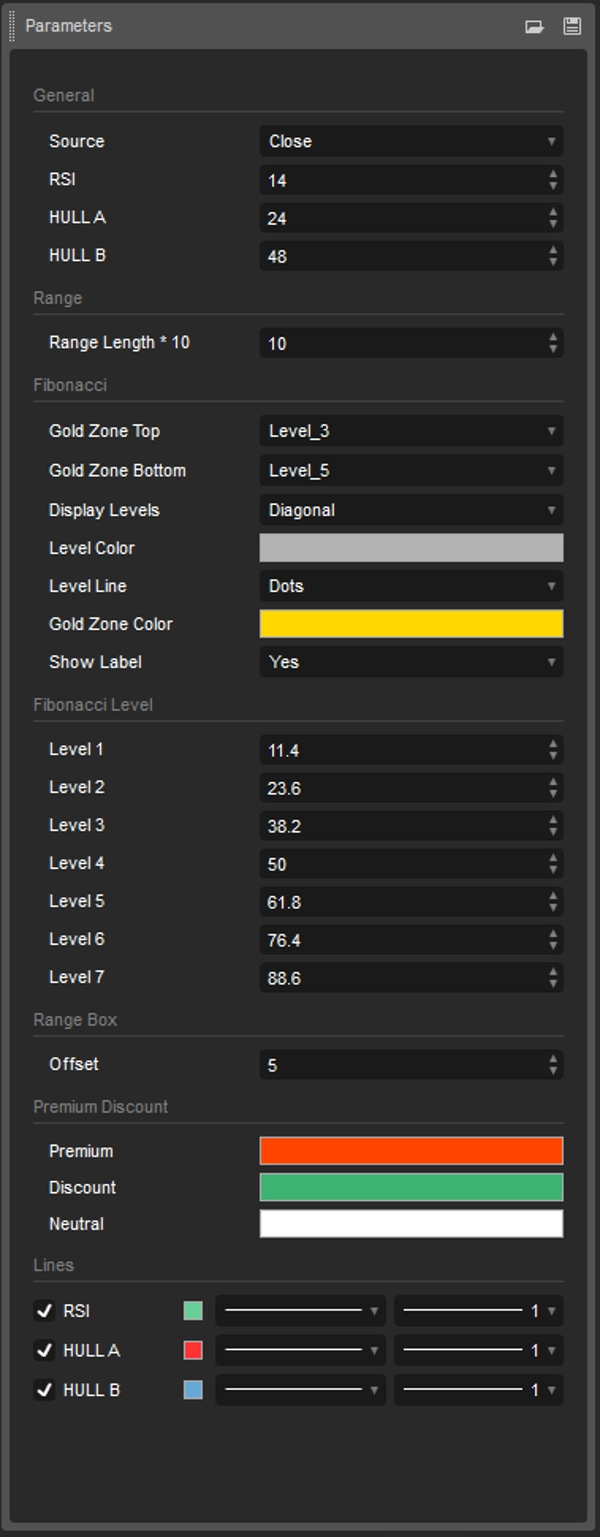
- Personalizzazione Completa:
-
- Regola i livelli di Fibonacci, i colori e gli stili delle linee secondo le tue preferenze.
- Configura le Medie Mobili Hull per adattarle alla tua strategia di trading.
- Visualizzazione Chiara:
-
- Icone e linee di tendenza ben definite per un'interpretazione rapida e semplice.
- Etichette opzionali per mostrare i livelli di Fibonacci in percentuale.
Vantaggi per i Trader:
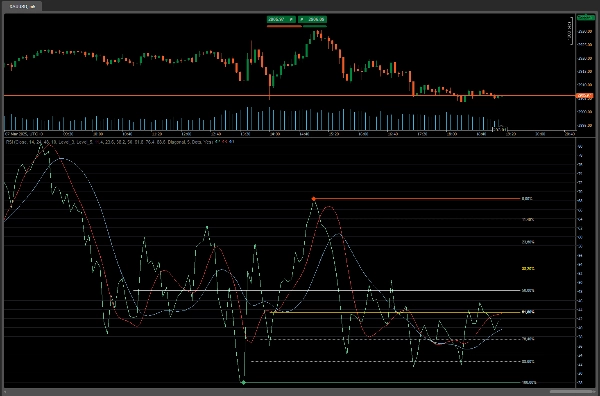
- Maggiore Precisione: Combina RSI con livelli di Fibonacci e Medie Mobili Hull per segnali più affidabili.
- Risparmio di Tempo: Non c'è bisogno di sovrapporre più indicatori; tutto è integrato in un unico strumento.
- Versatilità: Funziona su qualsiasi timeframe e mercato (forex, azioni, criptovalute, ecc.).
- Facilità d'Uso: Progettato per trader di tutti i livelli, dai principianti agli esperti.
Perché scaricare questo indicatore?
- Innovativo: Una combinazione unica di strumenti classici e moderni che non troverai in altri indicatori.
- Efficace: Ti aiuta a identificare opportunità di trading con maggiore chiarezza e fiducia.
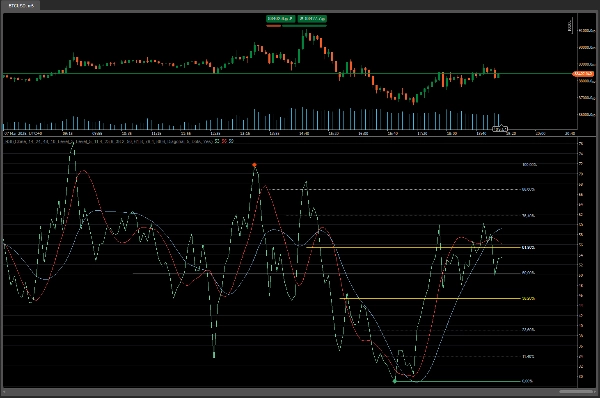
Come usarlo:
- Identifica la Tendenza: Usa le Medie Mobili Hull per determinare la direzione del mercato.
- Cerca segnali RSI: Controlla se l'RSI è in condizioni di ipercomprato o ipervenduto vicino ai livelli di Fibonacci.
- Conferma con Fibonacci: Usa i livelli di Fibonacci per identificare zone chiave di supporto e resistenza.
- Prendi decisioni informate: Entra o esci dalle operazioni con maggiore fiducia basandoti su segnali chiari e precisi.
Scarica ora e migliora il tuo trading!
Non perdere altro tempo ad analizzare manualmente i grafici. Con questo indicatore, avrai tutto ciò di cui hai bisogno in un unico posto. Rendi il tuo trading più efficiente e redditizio!
E con due strumenti puoi smettere di preoccuparti di cosa farà il mercato, con un semplice sguardo saprai – comprare o vendere e passare a un'altra attività.
RangeBoxFibonacci: https://ctrader.com/products/526?u=VIZAINT
OrderPrice-V3: https://ctrader.com/products/397?u=VIZAINT
E per scegliere
NTMPICLL https://ctrader.com/products/327?u=VIZAINT
MacdVolume https://ctrader.com/products/267?u=VIZAINT
MarketSession-MX: https://ctrader.com/products/525?u=VIZAINT
5 | 100 % | |
4 | 0 % | |
3 | 0 % | |
2 | 0 % | |
1 | 0 % |


