


설명
#### 기능
- **사용자 지정 가능한 기간**: 사용자는 특정 기간(예: 일간)을 선택하여 시가 수준을 분석할 수 있습니다. 1시간 미만의 TF는 설정하지 마십시오.
- **되돌아보기 기간**: 이 지표는 되돌아보기 기간을 지원하여 트레이더가 최근 가격 움직임에 집중하고 관련 관심 지점을 식별할 수 있게 합니다.
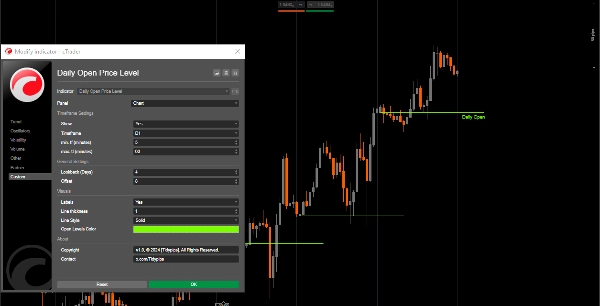
- **동적 추세선**: 선택한 기간의 시가를 나타내는 추세선을 그려 잠재적인 지지 및 저항 수준에 대한 명확한 시각적 신호를 제공합니다.
- **라벨 옵션**: 트레이더는 차트에 시가를 직접 표시하는 라벨을 활성화하여 명확성과 이해도를 높일 수 있습니다.
- **시각적 사용자 지정**: 사용자는 선 색상, 스타일 및 두께를 자신의 취향에 맞게 조정하여 차트 가독성을 향상시킬 수 있습니다.
- **기간 제한**: 이 지표는 지정된 최소 및 최대 기간 설정 내에서만 작동하도록 확인하여 오해의 소지가 있는 신호를 방지합니다.
#### 튜토리얼
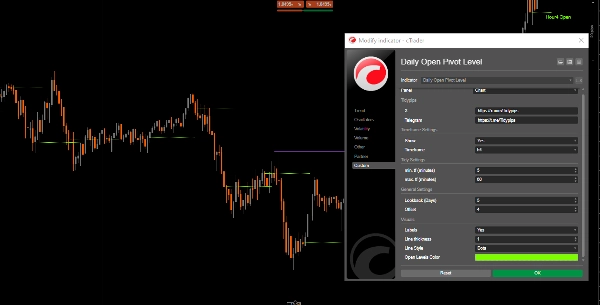
1. **설정**: 지표 설정을 열어 원하는 기간, 되돌아보기 기간을 선택하고 선 색상 및 두께와 같은 시각적 매개변수를 사용자 지정합니다.
2. **지표 사용**: 적용하면 지정된 설정에 따라 차트에 시가 수준이 자동으로 표시됩니다.
3. **분석**: 거래 중에 표시된 수준을 관찰하세요. 이 수준을 사용하여 잠재적인 지지 및 저항 구역을 식별하고 정보에 입각한 거래 결정을 내리세요.
#### 추천 동반 도구
- **cTrader**: cAlgo의 기본 플랫폼으로, 지표 사용 및 사용자 지정을 원활하게 제공합니다.
- **기술 분석 도구**: 이동 평균선이나 오실레이터와 같은 다른 도구와 이 지표를 결합하여 거래 전략과 시장 분석을 강화하세요.
- **위험 관리 도구**: 포지션 크기 계산기 및 손절매 도구를 활용하여 식별된 시가 수준 주변에서 효과적으로 위험을 관리하세요.
Daily Open Pivot Level Indicator를 이러한 도구들과 통합함으로써, 트레이더는 시장 분석을 향상시키고 당일 거래의 복잡성을 극복하는 데 성공 가능성을 높일 수 있습니다.
요약
고객 리뷰
5 | 100 % | |
4 | 0 % | |
3 | 0 % | |
2 | 0 % | |
1 | 0 % |


