
설명
차트에 표시하는 데 시간이 너무 오래 걸리나요? 이 지표가 매우 빠르게 대신해줍니다.
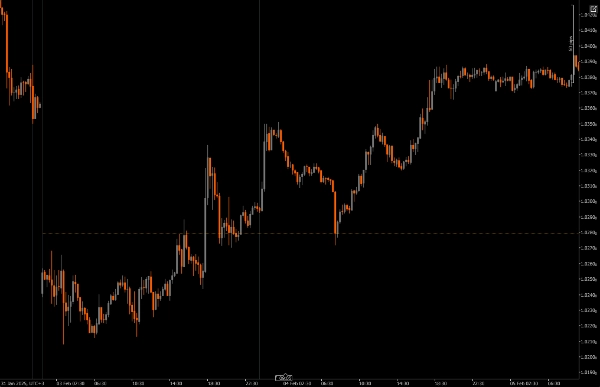
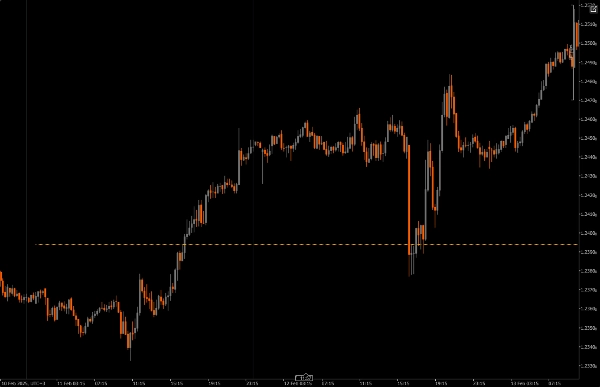
이전 날의 고가와 저가 사이의 중간 지점을 찾아 차트에 표시합니다. 이제 차트를 매우 빠르게 스캔할 수 있습니다. 아주 간단해요!
몇 가지 멋진 기능
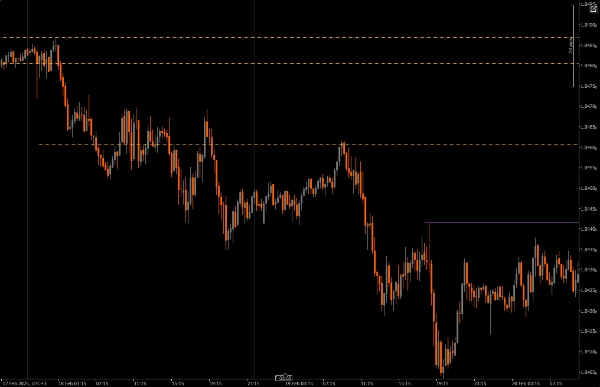
사용자 지정 참조 기간: 중요한 가격 수준을 표시할 최소 및 최대 기간을 선택할 수 있어, 일중 거래를 더 넓은 시장 추세와 맞출 수 있습니다.
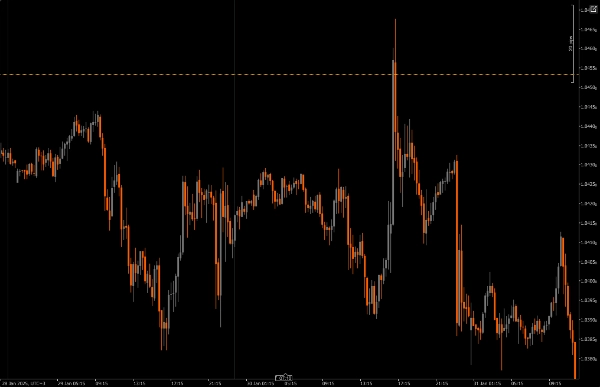
이 지표가 특별한 점은 주간 캔들이 일별로 생성되는 것을 따라가면서 주간 캔들의 확장을 쉽게 포착할 수 있다는 점입니다.
오프셋 매개변수: 이 기능은 표시된 수준이 미래 어느 정도까지 연장될지 결정할 수 있게 해주어, 잠재적인 미래 가격 지속 구역을 더 명확하게 파악할 수 있습니다.
시각적 사용자 지정: 선 스타일, 두께, 색상을 조정할 수 있는 다양한 옵션이 있어 개인 스타일에 맞고 읽기 쉬운 차트를 쉽게 만들 수 있습니다.
기간 제한: 이 지표는 지정한 기간 설정 내에서만 작동하도록 확인하는 기능이 포함되어 있어, 다른 기간을 순환할 때 차트가 복잡해지는 것을 방지할 수 있습니다.
주의할 점:
개인적으로 좋아하는 지표
저처럼 차트에 립스틱 표시를 떼어놓지 못한다면 이 지표를 사용해 보세요. 기간 제한과 되돌아보기 기능이 있어 차트 복잡도를 줄이는 데 도움이 됩니다.
이 지표는 주간 캔들이 어떻게 발전하는지 추적하는 데 유용합니다; 주간 확장이 강세 주문 흐름의 신호를 보이면 이 지표의 피벗 수준은 강세 확장에 참여할 영역이나 구역을 시각화합니다. 마찬가지로, 주간 확장이 약세 주문 흐름을 보이면 이 지표의 피벗 수준은 약세 확장에 참여할 영역이나 구역을 시각화합니다.
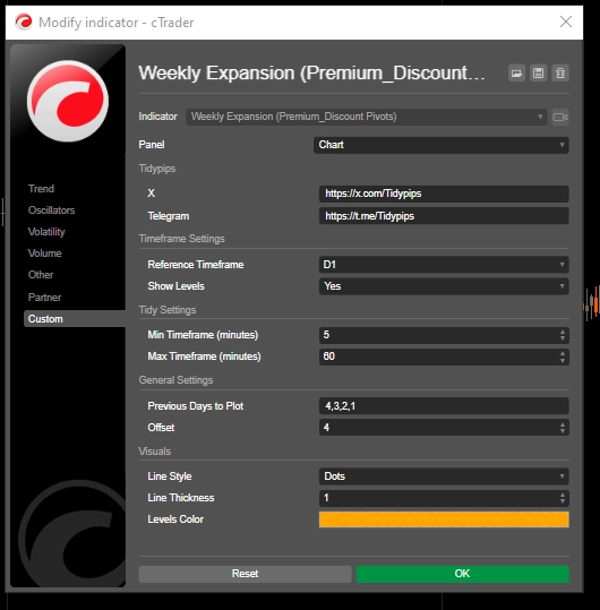
설치: cAlgo 플랫폼에서 Previous Day Equilibrium을 다운로드하고 설치하는 것부터 시작하세요.
설정: 설정을 열어 참조 기간을 선택하고, 표시할 이전 일수를 선택하며, 시각적 설정을 원하는 대로 맞추세요.
분석: 거래하면서 차트에 표시된 수준을 주시하세요. 이 수준은 과거 가격 움직임을 기반으로 가격이 반전할 수 있는 지점을 나타내어 더 정보에 기반한 결정을 내리는 데 도움을 줍니다.
실행: 이 수준을 사용하여 진입 및 청산 지점, 손절매 및 이익 실현 주문을 결정하고 전체 거래 전략에 통합하세요.
추천 동반 도구:
cTrader: Previous Day Equilibrium을 사용하기에 가장 좋은 플랫폼으로, 사용자 지정 및 분석에 원활한 경험을 제공합니다.
기술 분석 도구: 이동 평균이나 오실레이터 같은 다른 도구와 함께 이 지표를 사용하여 시장 추세를 더 완벽하게 파악하세요.
위험 관리 도구: 계산기와 손절매 도구를 활용하여 이러한 주요 수준 주변에서 거래할 때 위험을 효과적으로 관리하세요.
Previous Day Equilibrium과 이러한 도구들을 함께 사용하면 거래 전략을 향상시키고 빠르게 변화하는 일중 거래 세계에서 성공 가능성을 높일 수 있습니다.
요약
고객 리뷰
5 | 0 % | |
4 | 100 % | |
3 | 0 % | |
2 | 0 % | |
1 | 0 % |


