
설명
사용자가 주요 거래 세션인 아시아, 런던, 뉴욕 및 런던 마감의 개장 및 폐장 시간을 사용자 지정 가능한 색상, 스타일 및 두께로 표시할 수 있게 해줍니다. 이 지표는 각 세션의 고점 및 저점 추세선을 그려 시장 행동에 대한 통찰을 제공합니다. 사용자 친화적인 드래그 앤 드롭(+Alt 키) 기능으로 세션의 고점과 저점을 빠르게 표시할 수 있습니다. 초보자와 경험 많은 트레이더 모두에게 적합하며, 다양한 시장 세션의 복잡성을 쉽게 탐색할 수 있게 도와줍니다.
특징
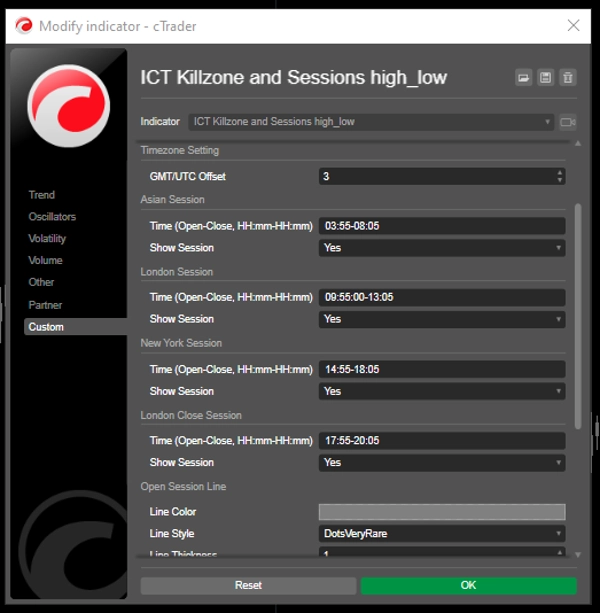
사용자 지정 가능한 세션 시간: 사용자는 주요 거래 세션(아시아, 런던, 뉴욕, 런던 마감)의 개장 및 폐장 시간을 정의할 수 있어, 자신의 거래 전략에 맞는 맞춤형 시각화를 할 수 있습니다.
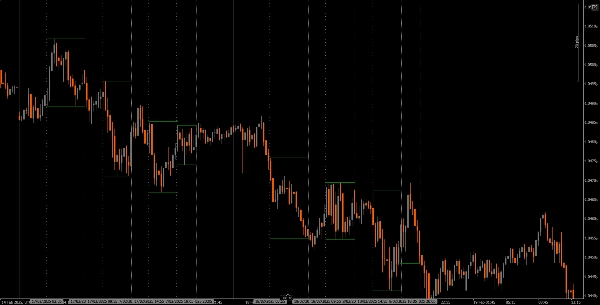
동적 수직선: 이 지표는 세션 개장 및 폐장 시간에 수직선을 그려 주요 시장 이벤트를 한눈에 쉽게 식별할 수 있게 합니다.
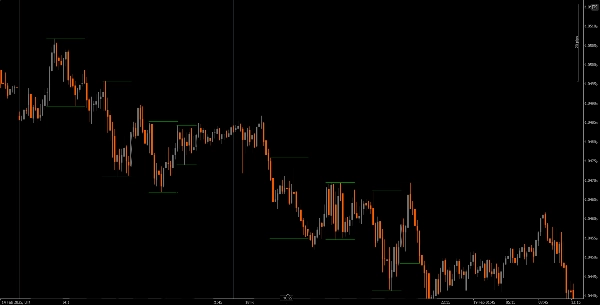
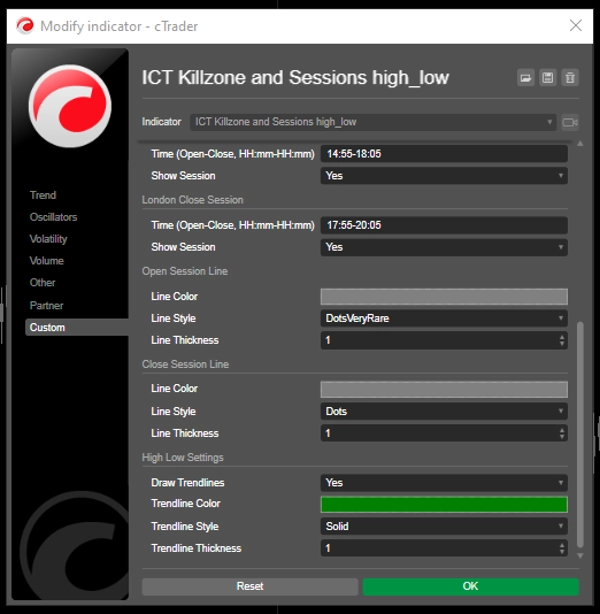
추세선 시각화: 각 세션에 대해 고점과 저점 추세선을 자동으로 그려 세션 가격 움직임을 기반으로 잠재적 지지 및 저항 수준을 확인할 수 있습니다.
사용자 친화적인 드래그 앤 드롭(+Alt 키): 드래그 앤 드롭(+Alt 키) 기능을 통해 트레이더가 분석할 특정 시간 범위를 쉽게 선택할 수 있어 전반적인 사용자 경험을 향상시킵니다.
세션 라벨: 세션 추세선 옆에 라벨을 표시하는 옵션이 있어 트레이더가 분석 중인 세션을 빠르게 식별하는 데 도움이 됩니다.
시간대 조정: 사용자는 GMT/UTC 오프셋을 설정할 수 있어 세션 시간이 자신의 현지 시간대에 맞게 정확하게 표시됩니다.
튜토리얼
설치: cAlgo 플랫폼에 The ICT Killzone and Sessions high_low 지표를 다운로드하여 설치합니다.
설정: 설정을 열어 세션 시간, 색상, 선 스타일 및 두께를 원하는 대로 사용자 지정합니다.
지표 사용법: 차트에서 클릭하고 드래그(+Alt 키)를 사용하여 분석하려는 시간 범위를 포함하는 사각형을 만듭니다. 지표가 지정된 세션에 대해 자동으로 수직선과 추세선을 그립니다.
분석: 거래 중에 세션 라인과 추세선을 관찰합니다. 이 정보를 사용하여 세션 역학을 기반으로 잠재적 지지 및 저항 수준을 식별합니다.
추천 동반 도구
cTrader: cAlgo의 기본 플랫폼으로, 지표 사용 및 사용자 지정을 원활하게 제공합니다.
시장 분석 도구: 이동 평균이나 오실레이터와 같은 시장 분석 도구와 이 지표를 결합하여 거래 전략을 강화합니다.
위험 관리 도구: 포지션 크기 계산기 및 손절매 도구를 사용하여 거래 중 위험을 효과적으로 관리합니다.
The ICT Killzone and Sessions high_low 지표를 이러한 도구들과 통합함으로써 트레이더는 시장 분석을 개선하고 다양한 거래 세션의 복잡성을 탐색하는 데 성공 가능성을 높일 수 있습니다.
요약
A drag-and-drop (+Alt Key) feature allows quick selection of specific time ranges for analysis. Optional session labels clarify which session is being viewed. Timezone adjustments via GMT/UTC offset ensure session times align with the trader’s local time zone.
Designed for use on the cAlgo platform, this tool supports enhanced market analysis when combined with other market analysis and risk management tools. It assists traders in navigating the complexities of different market sessions by providing clear visual cues and trendline insights.
고객 리뷰
5 | 40 % | |
4 | 20 % | |
3 | 0 % | |
2 | 0 % | |
1 | 40 % |


