설명
유동성 압력 지수는 거래자에게 시장 유동성의 숨겨진 역학을 더 깊이 들여다볼 수 있도록 설계된 전문가급 도구입니다. 가격에만 반응하는 전통적인 오실레이터와 달리, 유동성 압력 지수는 틱 거래량, 변동성 압축, 방향성 흐름을 하나의 읽기 쉬운 선으로 결합합니다. 이는 캔들 뒤에서 매수 또는 매도 압력이 실제로 지배적인지 이해하고자 하는 거래자에게 강력한 동반자가 됩니다.
기본적으로 ALB는 누적 매수 유동성과 누적 매도 유동성 간의 균형을 계산하고, 결과를 롤링 틱 거래량에 대해 정규화합니다. 출력값은 중립 수준인 50을 중심으로 합니다. 50 이상은 더 강한 매수 유동성을 나타내며, 50 이하 값은 더 강한 매도 유동성을 강조합니다.
이 간단한 시각적 신호는 거래자가 여러 지표를 동시에 해석할 필요 없이 기본 주문 흐름을 즉시 파악할 수 있게 합니다.
지표 읽는 법
50 이상 선: 시장은 더 강한 매수 측 유동성을 보여줍니다. 이는 종종 강세 지속을 지지하거나 매도 주문을 흡수하는 숨겨진 수요를 신호합니다.
50 이하 선: 시장은 더 강한 매도 측 유동성을 보여줍니다. 이는 종종 약세 지속을 지지하거나 매수 주문을 흡수하는 숨겨진 공급을 신호합니다.
50 근처 또는 평탄: 유동성이 균형을 이루어 우유부단함이나 통합을 시사합니다.
스무딩 옵션: 거래자는 노이즈를 줄이고 지배적인 유동성 추세에 집중하기 위해 EMA 또는 KAMA 스무딩 중 선택할 수 있습니다.
작동 원리
이 지표는 먼저 진폭 변동성(ATR)을 측정하고 실제 캔들 범위와 비교하여 압축을 추정합니다. 그런 다음 이를 틱 거래량과 결합하여 대기 중인 유동성(주문 대기)과 실행된 유동성(이미 체결된 주문)을 구분합니다. 캔들 방향에 따라 알고리즘은 숨겨진 매수 또는 매도 흡수를 할당합니다. 마지막으로 결과는 틱 거래량의 롤링 EMA에 대해 정규화되고, 스케일링 및 스무딩되어 명확성을 높입니다.
결과는 시장 상황에 적응하며 실시간으로 매수자와 매도자 간의 줄다리기를 드러내는 동적 유동성 지수입니다.
주요 특징
유동성 중심 통찰력: 가격을 넘어 숨겨진 매수/매도 압력을 드러냅니다.
적응형 스무딩: 노이즈 감소를 위해 EMA 또는 KAMA 중 선택 가능.
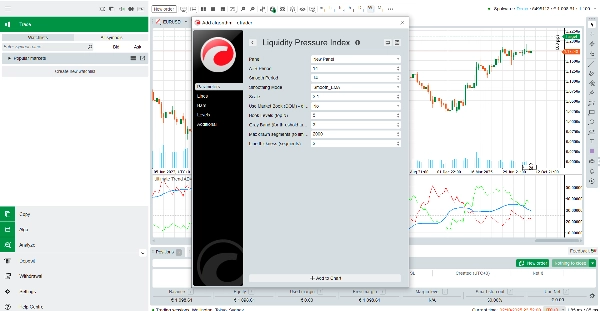
사용자 정의 가능한 매개변수: ATR 기간, 스무딩 길이, 스케일 및 선 두께 조절 가능.
최적화된 성능: 부드러운 차트 작성을 위한 세그먼트 제한을 갖춘 경량 설계.
왜 유동성 압력 지수를 사용해야 할까요?
빠르게 움직이는 시장에서는 가격만으로는 오해를 불러일으킬 수 있습니다. 고급 유동성 균형은 거래자에게 시장이 실제로 유동성에 의해 지지되는지, 아니면 약한 참여로 움직이는지에 대한 더 깊은 관점을 제공합니다. 단기 불균형을 찾는 스캘퍼든 추세 강도를 확인하는 스윙 트레이더든, 유동성 압력 지수는 전문가급 유동성 렌즈를 제공하며, 무엇보다도 완전히 무료입니다.
오늘 다운로드하여 거래 결정에 새로운 명확성 차원을 추가하세요.
요약
고객 리뷰
5 | 0 % | |
4 | 100 % | |
3 | 0 % | |
2 | 0 % | |
1 | 0 % |