
Penerangan
Ultimate Trend ADX adalah versi yang kuat dan dipertingkatkan dari Indeks Arah Purata (ADX) klasik, direka untuk memberikan pedagang pandangan yang lebih jelas dan dinamik mengenai tren dan momentum pasaran. Berbeza dengan ADX standard, alat yang dipertingkatkan ini menggunakan teknik pelicinan lanjutan (EMA atau KAMA) dan memperkenalkan pilihan penskalaan untuk menjadikan garis penunjuk lebih responsif dan memberi impak visual yang lebih kuat. Hasilnya adalah penunjuk tahap profesional yang membantu anda mengenal pasti tren yang kuat, mengesan pembalikan, dan mengesahkan kemasukan dengan keyakinan yang lebih tinggi.
Cara Membaca Penunjuk
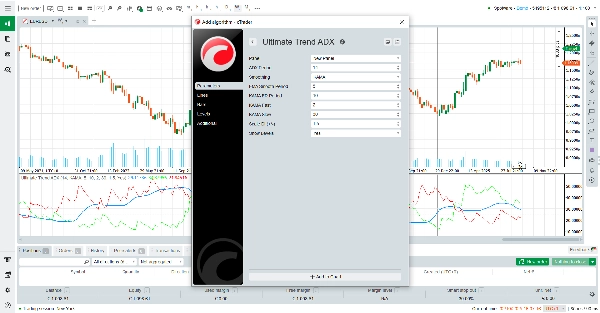
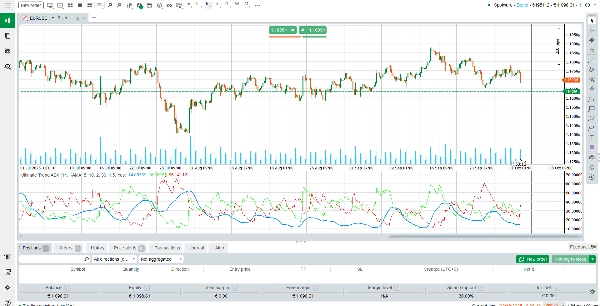
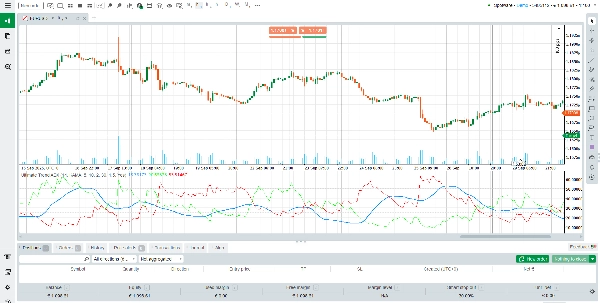
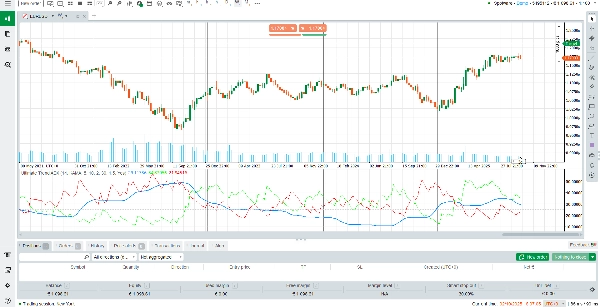
Ultimate Trend ADX memaparkan tiga garis utama dalam tetingkap berasingan di bawah carta anda:
Garis ADX (Biru/Kuning): Mengukur kekuatan keseluruhan tren. ADX yang meningkat menunjukkan tren yang menguat, manakala ADX yang menurun menunjukkan momentum yang melemah. Nilai di atas 25 biasanya menandakan tren yang kuat.
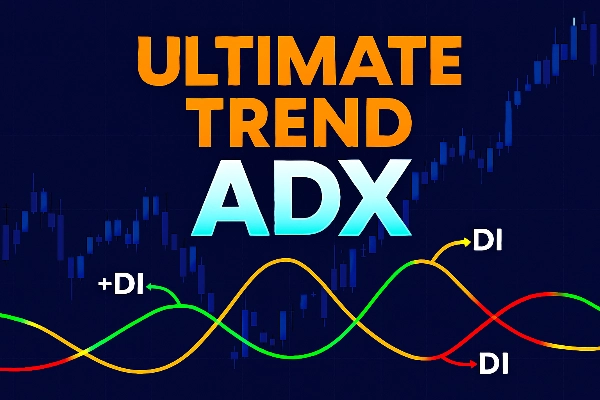
Garis +DI (Hijau): Mewakili pergerakan arah menaik. Apabila +DI berada di atas –DI, pembeli menguasai.
Garis –DI (Merah): Mewakili pergerakan arah menurun. Apabila –DI berada di atas +DI, penjual menguasai pasaran.
Membaca isyarat adalah mudah:
Apabila +DI melintasi di atas –DI dan ADX meningkat, ia menunjukkan tren menaik yang kuat.
Apabila –DI melintasi di atas +DI dan ADX meningkat, ia menandakan tren menurun yang kuat.
Apabila ADX berada di bawah 20–25, pasaran biasanya berada dalam julat atau kekurangan arah yang jelas.
Penunjuk ini juga termasuk tahap mendatar pada 0, 25, 50, 75, dan 100 untuk membantu anda menilai intensiti tren dengan cepat.
Bagaimana Penunjuk Berfungsi
Ultimate Trend ADX dibina berdasarkan Sistem Pergerakan Arah standard tetapi dipertingkatkan dengan algoritma pelicinan moden:
Purata Pergerakan Eksponen (EMA): Menyediakan pilihan pelicinan yang pantas dan responsif untuk pedagang yang ingin menangkap momentum jangka pendek.
Purata Pergerakan Adaptif Kaufman (KAMA): Menyesuaikan secara dinamik dengan volatiliti pasaran, menapis bunyi semasa keadaan mendatar sambil kekal sensitif semasa tren kuat.
Faktor Penskalaan untuk +DI dan –DI: Memperkuat garis hijau dan merah, menjadikan isyarat menaik dan menurun lebih jelas dan mudah ditafsirkan pada carta.
Gabungan ini memastikan penunjuk menyesuaikan diri dengan persekitaran pasaran yang berbeza, memberikan anda kejelasan dan ketepatan.
Ciri-ciri Utama
Pengiraan ADX Dipertingkat – Menggunakan pelicinan EMA atau KAMA untuk pengukuran kekuatan tren yang lebih tepat dan adaptif.
Isyarat Visual Jelas – Kod warna yang berbeza (biru/kuning untuk ADX, hijau untuk +DI, merah untuk –DI) menjadikan tafsiran intuitif.
Kepekaan Boleh Laras – Parameter membolehkan anda melaras responsif mengikut gaya dagangan anda.
Tahap Mendatar Terbina Dalam – Tahap rujukan cepat (0/25/50/75/100) membantu anda menilai intensiti tren dengan segera.
Mengapa Memilih Ultimate Trend ADX?
Kejayaan dagangan sering bergantung pada mengenal pasti bila pasaran sedang tren dan bila tidak. Ultimate Trend ADX memberi anda kelebihan itu dengan menggabungkan kebolehpercayaan ADX klasik dengan penambahbaikan moden yang menjadikannya lebih tajam, jelas, dan lebih boleh digunakan. Sama ada anda berdagang forex, saham, indeks, atau komoditi, penunjuk ini akan membantu anda menapis bunyi, mengesahkan isyarat, dan kekal selari dengan arah pasaran semasa.
Ringkasan
This indicator incorporates exponential moving average (EMA) or Kaufman’s adaptive moving average (KAMA) smoothing techniques to improve responsiveness and reduce noise. It also features a scaling factor for the +DI and –DI lines, enhancing signal visibility. Horizontal reference levels at 0, 25, 50, 75, and 100 assist in quickly assessing trend intensity.
Ultimate Trend ADX supports multiple markets including forex, stocks, indices, commodities, and cryptocurrencies. It is suitable for various trading strategies such as scalping, breakout, and grid trading. Adjustable sensitivity settings allow customization to fit different trading styles. This tool aids traders in identifying strong trends, spotting reversals, and confirming entry signals with improved clarity and precision.
Ulasan pelanggan
5 | 100 % | |
4 | 0 % | |
3 | 0 % | |
2 | 0 % | |
1 | 0 % |


