
Tracking Performance by Quantara
อินดิเคเตอร์
31 ดาวน์โหลด
เวอร์ชัน 1.0, Feb 2026
Windows, Mac
คำอธิบาย
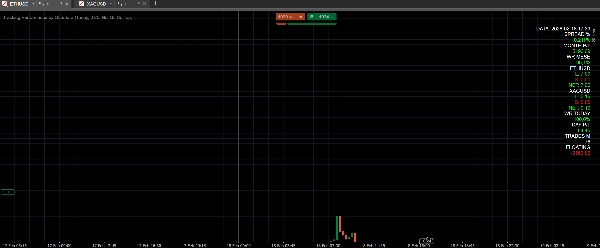
Tracking Perfromance by Quantara เป็น ตัวชี้วัดแดชบอร์ด ที่แสดงเมตริกประสิทธิภาพแบบเรียลไทม์และการเปิดเผยต่อสินทรัพย์แต่ละรายการ
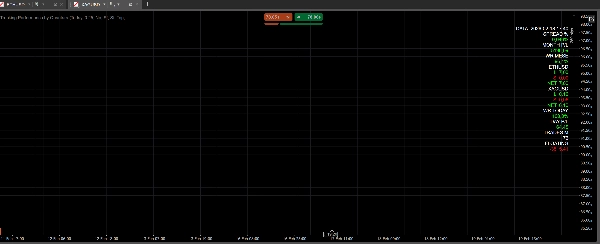
จะแสดง: กำไร/ขาดทุนรายเดือนและรายวัน อัตราการชนะรายเดือนและรายวัน จำนวนการซื้อขายรายเดือน กำไร/ขาดทุนลอยตัว ส่วนต่างเป็นเปอร์เซ็นต์ และสถานะซื้อ/ขาย/สุทธิสำหรับสินทรัพย์เปิดแต่ละรายการ
ค่าทั้งหมดถูกระบุด้วยสีเพื่อการอ่านอย่างรวดเร็ว (กำไร/ขาดทุนบวก/ลบ เกณฑ์อัตราการชนะ สีเขียวสำหรับสถานะซื้อ สีแดงสำหรับสถานะขาย)
สิ่งที่คำนวณ/แสดง
- ส่วนต่าง % (พร้อมเกณฑ์ต่างกันสำหรับโลหะและคริปโต)
- กำไร/ขาดทุนรายเดือนและรายวัน
- อัตราการชนะรายเดือนและรายวัน
- จำนวนการซื้อขายรายเดือน
- กำไร/ขาดทุนลอยตัว
- การเปิดเผยต่อสินทรัพย์แต่ละรายการ (สถานะซื้อ / ขาย / สุทธิ)
เครื่องมือ/กรอบเวลาที่แนะนำ
- ใช้งานได้กับ เครื่องมือใดก็ได้ และ กรอบเวลาใดก็ได้
- แนะนำบนแผนภูมิหลัก (M15–H4) สำหรับการติดตามรายวัน
วิธีใช้
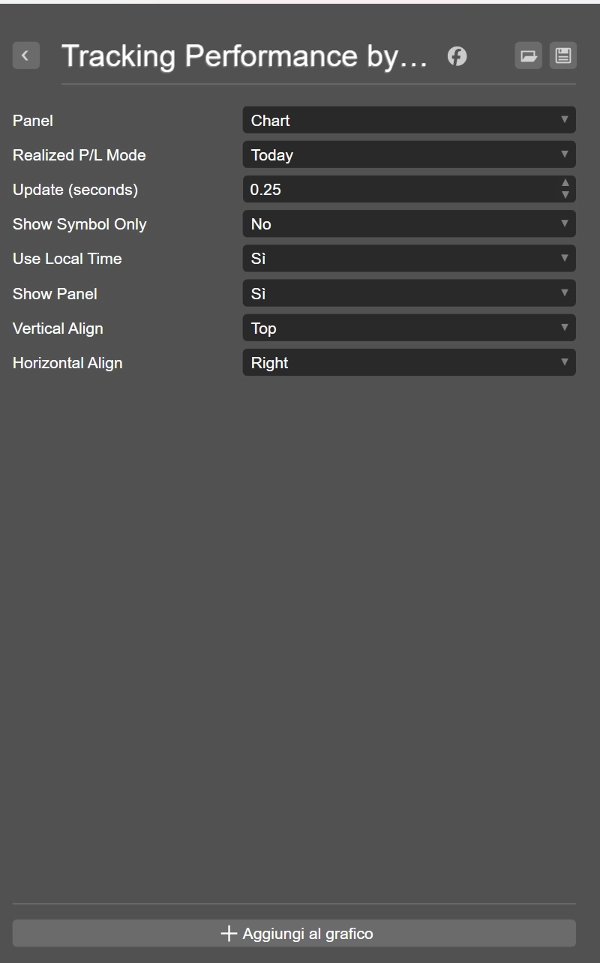
- เพิ่มตัวชี้วัดลงในแผนภูมิ
- ตั้งค่าช่วงเวลาการอัปเดต (Update seconds)
- ใช้ Show Panel เพื่อสลับการแสดงผล
- ใช้ “Show Symbol Only” เพื่อกรองเฉพาะสัญลักษณ์ในแผนภูมิ
- ใช้ “Use Local Time” เพื่อใช้ตัวกรองเวลาท้องถิ่น
พารามิเตอร์หลัก
- Update (seconds): ความถี่ในการรีเฟรช
- Show Symbol Only: แสดงเฉพาะสัญลักษณ์ในแผนภูมิ
- Use Local Time: ใช้เวลาท้องถิ่นสำหรับตัวกรอง
- Show Panel: แสดง/ซ่อนแผงควบคุม
- Vertical/Horizontal Align: การจัดวางแผงควบคุม
กรณีการใช้งาน
- ตรวจสอบสถานะสุทธิของแต่ละสินทรัพย์อย่างรวดเร็ว
- ติดตามประสิทธิภาพรายวันและรายเดือน
- ติดตามอัตราการชนะเพื่อคุณภาพการดำเนินงาน
- ติดตามส่วนต่าง % สำหรับโลหะและคริปโต
ข้อจำกัดความรับผิดชอบ
การซื้อขายมีความเสี่ยง ผลการดำเนินงานในอดีตไม่รับประกันผลลัพธ์ในอนาคต
สรุป
สรุปโดย AI
Tracking Performance by Quantara is a dashboard indicator designed for real-time monitoring of trading performance across multiple assets. It provides key metrics including monthly and daily profit and loss (P/L), win rate, trade count, floating P/L, and spread percentage, with specific thresholds for metals and cryptocurrencies. The indicator also displays per-asset exposure categorized as long, short, or net positions. All values are dynamically color-coded to facilitate quick interpretation, highlighting positive/negative P/L, win-rate levels, and position types.
This tool is compatible with any trading instrument and timeframe, with a recommendation for use on main charts ranging from 15-minute to 4-hour intervals for daily performance tracking. Users can customize update frequency, toggle panel visibility, filter data to the current chart symbol, and apply local time settings. The indicator supports quick assessment of net exposure, daily and monthly performance, win-rate monitoring, and spread percentage analysis for metals and crypto markets.
Key parameters include update interval, symbol filtering, local time usage, panel display options, and panel alignment. This indicator is applicable across Forex, Indices, Commodities, Crypto, and Stocks markets.
โปรไฟล์อินดิเคเตอร์
รีวิวจากลูกค้า
0.0
รีวิว: 0
รีวิวจากลูกค้า
ยังไม่มีรีวิวสำหรับผลิตภัณฑ์นี้ หากเคยลองแล้ว ขอเชิญมาเป็นคนแรกที่บอกคนอื่น!
การสนทนา
คำถามที่พบบ่อย
Forex
Indices
Commodities
Crypto
Stocks
ผลิตภัณฑ์ที่มีให้บริการผ่าน cTrader Store รวมถึงบอทการเทรด อินดิเคเตอร์ และปลั๊กอิน มีให้บริการโดยนักพัฒนาบุคคลที่สามและมีไว้เพื่อวัตถุประสงค์ในการเข้าถึงข้อมูลและทางเทคนิคเท่านั้น cTrader Store ไม่ใช่โบรกเกอร์และไม่ได้ให้คำแนะนำการลงทุน คำแนะนำส่วนบุคคล หรือการรับประกันผลการดำเนินงานในอนาคต


ราคา
ตั้งแต่ 29/01/2026
31
ติดตั้งฟรี