
support and resistance
อินดิเคเตอร์
13 การซื้อ
เวอร์ชัน 1.0, Jun 2025
Windows, Mac
4.3
รีวิว: 3
คำอธิบาย
คุณสมบัติหลัก:
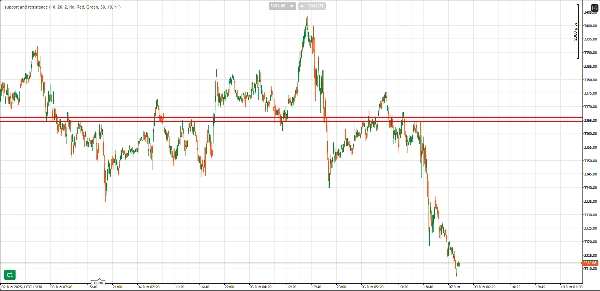
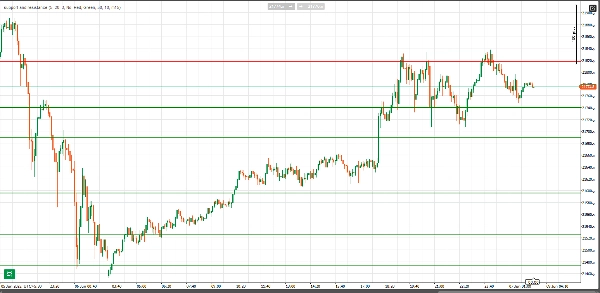
- การตรวจจับแนวรับและแนวต้านโดยอัตโนมัติ: ตัวบ่งชี้จะระบุระดับแนวรับและแนวต้านที่สำคัญโดยอัตโนมัติตามการเคลื่อนไหวของราคา โดยเน้นโซนเหล่านี้ที่ราคากลับตัวหรือหยุดนิ่งหลายครั้ง
- การตรวจสอบจำนวนการเด้ง: ระดับแนวรับและแนวต้านจะได้รับการตรวจสอบตามจำนวนครั้งที่ราคาตอบสนอง (การเด้ง) จากระดับนั้น ยิ่งมีการเด้งมาก ระดับนั้นก็ยิ่งแข็งแกร่ง คุณสามารถปรับจำนวนการเด้งขั้นต่ำเพื่อให้ระดับนั้นถือว่าเป็นระดับที่ถูกต้อง เพื่อให้แน่ใจว่าเฉพาะระดับที่สำคัญสูงเท่านั้นที่ถูกทำเครื่องหมาย
- ปรับแต่งรูปแบบเส้นได้: ความหนาและรูปแบบของเส้นแนวรับและแนวต้านจะถูกปรับโดยอัตโนมัติตามจำนวนการเด้ง ระดับที่มีการเด้งมากกว่าจะถูกวาดด้วยเส้นที่หนาและโดดเด่นมากขึ้น เพื่อเน้นความสำคัญของระดับนั้น
- ความกว้างของโซน (พิปส์): คุณสามารถกำหนดโซนบัฟเฟอร์รอบระดับแนวรับและแนวต้านในหน่วยพิปส์ ซึ่งช่วยในการระบุการเคลื่อนไหวของราคาภายในช่วงที่ราคาสามารถกลับตัวหรือมีปฏิกิริยาได้
- ตัวกรองช่วงเวลาที่สูงกว่า: คุณสมบัติพิเศษของตัวบ่งชี้นี้คือความสามารถในการตรวจสอบความถูกต้องของระดับแนวรับและแนวต้านโดยใช้ ตัวกรองช่วงเวลาที่สูงกว่า โดยการเลือกช่วงเวลาที่สูงกว่า (เช่น 1H, 4H) ตัวบ่งชี้จะตรวจสอบระดับที่ระบุเทียบกับการเคลื่อนไหวของราคาที่สำคัญในช่วงเวลาที่สูงกว่า เพื่อให้แน่ใจว่าเฉพาะระดับที่สำคัญเท่านั้นที่ถูกวาดบนแผนภูมิ
- การแจ้งเตือน: เมื่อราคาก้าวเข้าสู่โซนของระดับแนวรับหรือแนวต้าน ตัวบ่งชี้สามารถแจ้งเตือนคุณด้วยเสียง เพื่อให้คุณไม่พลาดการตอบสนองของราคาที่สำคัญ
- สีที่ปรับแต่งได้: คุณสามารถเปลี่ยนสีของเส้นแนวรับและแนวต้านได้อย่างง่ายดายเพื่อให้เหมาะกับความชอบของคุณหรือสอดคล้องกับธีมการเทรดของคุณ
- การป้องกันการทับซ้อน: ตัวบ่งชี้มี ตัวกรองเกณฑ์ ที่ป้องกันการวาดระดับแนวรับและแนวต้านที่ทับซ้อนกันซึ่งอยู่ใกล้กันเกินไป เพื่อให้แน่ใจว่าแสดงเฉพาะระดับที่ไม่ซ้ำและสำคัญเท่านั้น
ประโยชน์:
- ประหยัดเวลา: ตรวจจับและแสดงระดับแนวรับและแนวต้านที่สำคัญโดยอัตโนมัติโดยไม่ต้องวาดด้วยตนเอง
- ภาพที่ชัดเจน: เห็นได้ง่ายว่าระดับแนวรับและแนวต้านใดมีความสำคัญที่สุดตามจำนวนการเด้งของราคาและการตรวจสอบช่วงเวลาที่สูงกว่า
- การแจ้งเตือนที่มีประสิทธิภาพ: รับการแจ้งเตือนทันเวลเมื่อการเคลื่อนไหวของราคาเข้าสู่ระดับสำคัญ ช่วยให้คุณสามารถดำเนินการได้อย่างรวดเร็วและมีประสิทธิภาพ
- การตัดสินใจเทรดที่ดีขึ้น: ใช้ตัวบ่งชี้นี้เพื่อเพิ่มความมั่นใจในการเข้าและออกการเทรด รวมถึงการวิเคราะห์ทางเทคนิคโดยรวมของคุณ
ตัวเลือกการปรับแต่ง:
- จำนวนแท่งย้อนหลัง: ปรับระยะเวลาที่ตัวบ่งชี้จะมองย้อนหลังเพื่อระบุระดับแนวรับและแนวต้านที่เป็นไปได้
- จำนวนการเด้งขั้นต่ำ: กำหนดจำนวนการเด้งขั้นต่ำที่จำเป็นสำหรับให้ระดับนั้นถือว่าเป็นระดับที่ถูกต้อง
- ช่วงเวลาที่สูงกว่า: กรองระดับแนวรับและแนวต้านตามช่วงเวลาที่สูงกว่า (เช่น แผนภูมิ 1 ชั่วโมง, 4 ชั่วโมง)
- สีเส้น: เลือกสีสำหรับเส้นแนวต้านและแนวรับให้เหมาะกับสไตล์แผนภูมิของคุณ
- การตั้งค่าการแจ้งเตือน: เปิดหรือปิดการแจ้งเตือนตามการที่ราคาก้าวเข้าสู่โซนแนวรับหรือแนวต้าน
สรุป
สรุปโดย AI
This indicator automatically detects key support and resistance levels by analyzing price action and identifying zones where price has reversed or stalled multiple times. It validates these levels based on the number of price bounces, allowing users to set a minimum bounce count to highlight only significant levels. The indicator visually emphasizes stronger levels by adjusting line thickness and style according to bounce count. Users can define a buffer zone around levels in pips to capture price reactions within a range.
A higher timeframe filter cross-checks identified levels against price action on selected higher timeframes (e.g., 1-hour, 4-hour), ensuring only important levels are displayed. Alerts notify users with audio signals when price enters support or resistance zones. The indicator prevents overlapping lines by applying a threshold filter, maintaining clarity on the chart. Colors of support and resistance lines are customizable to fit user preferences.
Customization options include adjusting lookback bars, minimum bounces, higher timeframe selection, line colors, and alert settings. This tool supports markets such as Forex, commodities, indices, and popular symbols including BTCUSD, EURUSD, GBPUSD, XAUUSD, NAS100, and USDJPY. It aids traders in saving time, improving visual clarity, receiving timely alerts, and making more confident trading decisions.
โปรไฟล์อินดิเคเตอร์
หมวดหมู่อินดิเคเตอร์
แนวรับและแนวต้าน
ประเภทเอาต์พุต
การแสดงเป็นภาพ
ข้อกำหนดด้านข้อมูล
แท่งเท่านั้น
สัญญาณที่รองรับ
Breakout
Reversal
รีวิวจากลูกค้า
4.3
รีวิว: 3
5 | 33 % | |
4 | 67 % | |
3 | 0 % | |
2 | 0 % | |
1 | 0 % |
รีวิวจากลูกค้า
June 11, 2025
Nice setup companion for a more controlled workflow. It helps with planning entries and exits around important areas, but not every zone holds, even if it looks clean. The cleanest use is 3 to 5 levels per chart, with 0.5 pullbacks checked before entry. I would still keep manual review in the process.
June 10, 2025
June 10, 2025
Decent option for checks around key price zones. The useful part is planning entries and exits around important areas, with the numbers checked before scaling. I would wait for 2 reactions and avoid trades where the target is less than 1.5R. Levels are useful when they reduce noise, not when they crowd the chart.
การสนทนา
คำถามที่พบบ่อย
BTCUSD
Prop
Forex
Breakout
Indices
EURUSD
Commodities
GBPUSD
NZDUSD
XAUUSD
NAS100
USDJPY
ผลิตภัณฑ์ที่มีให้บริการผ่าน cTrader Store รวมถึงบอทการเทรด อินดิเคเตอร์ และปลั๊กอิน มีให้บริการโดยนักพัฒนาบุคคลที่สามและมีไว้เพื่อวัตถุประสงค์ในการเข้าถึงข้อมูลและทางเทคนิคเท่านั้น cTrader Store ไม่ใช่โบรกเกอร์และไม่ได้ให้คำแนะนำการลงทุน คำแนะนำส่วนบุคคล หรือการรับประกันผลการดำเนินงานในอนาคต


ราคา
ตั้งแต่ 30/05/2025
40
การขาย