
Professional-grade Anchored VWAP
อินดิเคเตอร์
3 การซื้อ
เวอร์ชัน 1.0, Nov 2025
Windows, Mac
4.5
รีวิว: 2
คำอธิบาย
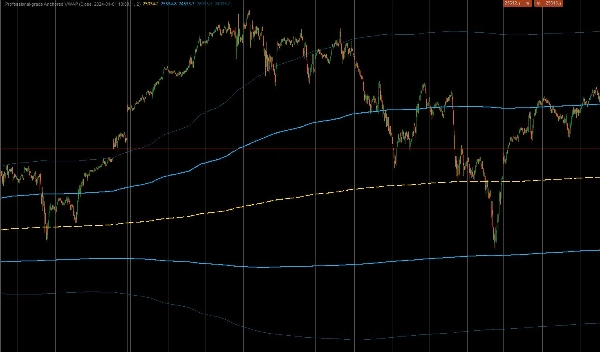
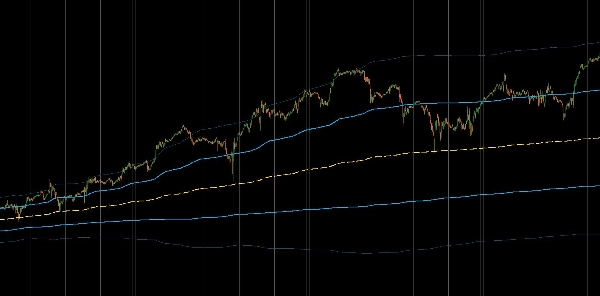
นี่คือตัวบ่งชี้แบบกำหนดเองระดับมืออาชีพสำหรับ cTrader ที่ออกแบบมาเพื่อคำนวณ Anchored Volume Weighted Average Price (AVWAP) แตกต่างจากตัวบ่งชี้ VWAP มาตรฐานที่รีเซ็ตทุกวัน เครื่องมือนี้ช่วยให้ผู้ค้า "ยึด" การคำนวณกับเหตุการณ์สำคัญเฉพาะ เช่น การปล่อย CPI, การล่มของตลาด หรือการเริ่มต้นแนวโน้ม เพื่อให้ได้มุมมองสถาบันที่แท้จริงของราคาเฉลี่ยตั้งแต่ช่วงเวลานั้น นอกจากนี้ยังรวมถึงแถบเบี่ยงเบนมาตรฐานถ่วงน้ำหนักด้วยปริมาณเพื่อระบุการเคลื่อนไหวของราคาที่เกินขอบเขต
1. การคำนวณหลัก & ตรรกะการยึด
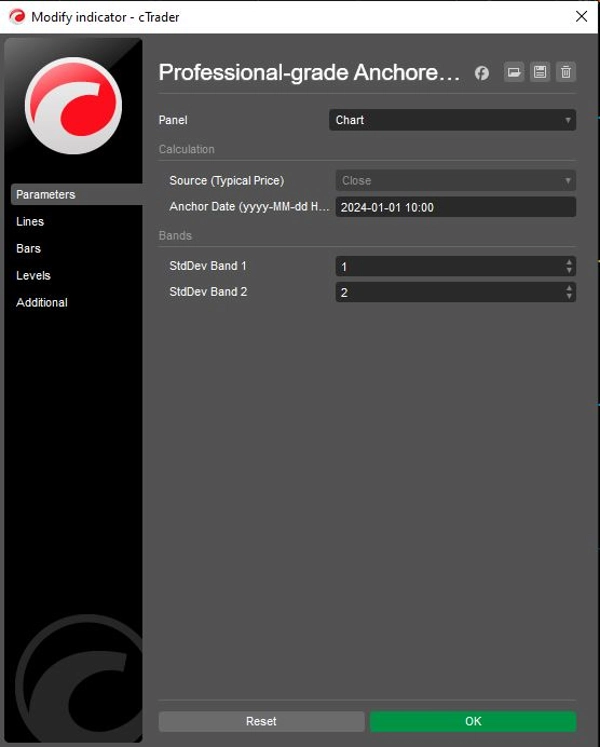
- การยึดที่แม่นยำ: ตัวบ่งชี้ใช้
Anchor Dateที่ผู้ใช้กำหนดเอง (เช่น "2024-01-01 10:00") เพื่อไม่สนใจข้อมูลทั้งหมดก่อนนาทีที่ระบุอย่างเคร่งครัด ซึ่งช่วยให้ราคาเฉลี่ยสะท้อนเฉพาะผู้เข้าร่วมที่เกี่ยวข้องกับการเคลื่อนไหวหรือกรอบเวลาปัจจุบันเท่านั้น - สูตรสถาบัน: คำนวณ VWAP ที่แท้จริงโดยใช้ผลรวมสะสมของ (ราคา × ปริมาณ) หารด้วยผลรวมสะสมของปริมาณ
- แหล่งราคาทั่วไป: โดยค่าเริ่มต้นจะใช้
Typical Price(High + Low + Close) / 3สำหรับการคำนวณ ซึ่งเป็นวิธีมาตรฐานที่อัลกอริทึมสถาบันใช้เพื่อกำหนดมูลค่ายุติธรรม แม้ว่าสามารถปรับเป็นราคาเปิดหรือราคาปิดได้
2. แถบความผันผวนขั้นสูง
เพื่อช่วยให้ผู้ค้าประเมินความสุดขั้วของตลาด ตัวบ่งชี้จะคำนวณชุดแถบไดนามิกสองชุดโดยอิงจาก Volume-Weighted Variance:
- แถบ 1 (โซนมูลค่า): ตั้งค่าเริ่มต้นที่ 1.0 Standard Deviation โซนภายในนี้โดยทั่วไปจะบรรจุ "เสียง" มูลค่ายุติธรรมของตลาด การทะลุออกจากโซนนี้มักบ่งชี้ถึงโมเมนตัม
- แถบ 2 (โซนสุดขีด): ตั้งค่าเริ่มต้นที่ 2.0 Standard Deviations ราคาที่ถึงแถบภายนอกนี้มีแนวโน้มเกินขอบเขตทางสถิติ มักบ่งชี้โอกาสกลับตัว (การลดความแรงของการเคลื่อนไหว) หรือการหมดแรงของแนวโน้มอย่างรุนแรง
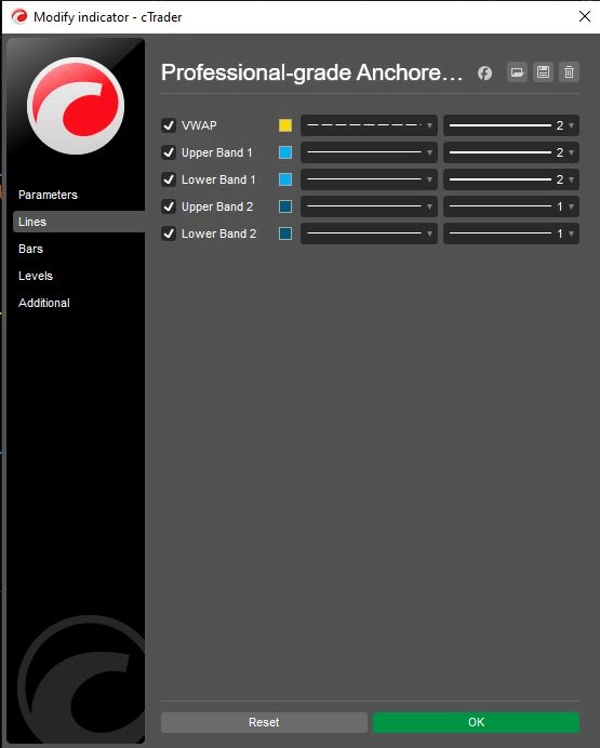
- การควบคุมอิสระ: ทั้งสองแถบมีสวิตช์
Showแยกกัน (ShowBand1,ShowBand2) และตัวคูณเบี่ยงเบนที่ปรับแต่งได้ (Band1Dev,Band2Dev) ช่วยให้ได้แผนภูมิที่สะอาดและเหมาะสมกับกลยุทธ์ความผันผวนเฉพาะ
3. ตรรกะการแสดงผลและการทำงาน
- การใช้สีเชิงกลยุทธ์:
-
- สีเหลือง (VWAP): ทำหน้าที่เป็น "แม่เหล็ก" หรือเส้นฐานแนวโน้มกลาง
- สีเขียวมะนาว (แถบ 1): แสดงถึง "พื้นที่มูลค่า" ที่เป็นแนวรับ/แนวต้านทันที
- สีแดง (แถบ 2): เน้นเบี่ยงเบนสุดขีดที่เพิ่มความน่าจะเป็นของการกลับตัว
- การรักษาสถานะ: โค้ดใช้
IndicatorDataSeriesสำหรับตัวแปรสถานะภายใน (_cumVol,_cumPV) เพื่อให้ค่าคงที่แม่นยำในระหว่างการคำนวณย้อนหลังและการอัปเดตแบบเรียลไทม์โดยไม่มีข้อผิดพลาดการวาดซ้ำ
สรุปตรรกะการทำงาน
- เริ่มต้น: แปลงสตริง Anchor Date ที่ผู้ใช้ระบุเป็นวัตถุ DateTime ของระบบ
- กรองเวลา: สำหรับแต่ละแท่งเทียน ตรวจสอบว่าเวลาปัจจุบันอยู่ก่อน Anchor หรือไม่ หากใช่ ให้คืนค่า
NaN(ไม่แสดงอะไร) และรีเซ็ตตัวนับสะสมเป็นศูนย์ - สะสมข้อมูล: เมื่อถึงเวลา Anchor ให้เริ่มเพิ่มปริมาณและ (ราคา × ปริมาณ) ของแท่งเทียนปัจจุบันลงในยอดรวมสะสม
- คำนวณ VWAP: หารยอดรวม PV สะสมด้วยยอดรวมปริมาณสะสมเพื่อให้ได้เส้น VWAP
- คำนวณความแปรปรวน: คำนวณความแปรปรวนถ่วงน้ำหนักด้วยปริมาณและหาค่าเบี่ยงเบนมาตรฐาน
- วาดแถบ: บวก/ลบค่าเบี่ยงเบนที่คำนวณได้จาก VWAP เพื่อวาดแถบสีเขียวมะนาวและสีแดง
สรุป
สรุปโดย AI
This professional-grade custom indicator for cTrader calculates the Anchored Volume Weighted Average Price (AVWAP) and volume-weighted standard deviation bands from a user-defined start date. Unlike standard VWAP indicators that reset daily, it anchors the VWAP calculation to a specific event or time, such as a market release or trend start, providing an institutional perspective on average price since that anchor point.
Key features include:
- Precision anchoring to a user-specified date and time, ignoring data before that moment.
- Institutional VWAP calculation using cumulative (Price × Volume) divided by cumulative Volume.
- Default use of Typical Price ((High + Low + Close) / 3) for fair value, adjustable to Open or Close prices.
- Two dynamic volatility bands based on volume-weighted variance: Band 1 (1 standard deviation) representing the value zone, and Band 2 (2 standard deviations) indicating extreme price deviations.
- Independent toggles and customizable deviation multipliers for each band.
- Strategic color coding: yellow for VWAP, lime green for Band 1, and red for Band 2.
- Internal state preservation ensures accurate values during historical and real-time updates without repainting.
The indicator supports markets including Forex, indices, commodities, stocks, and cryptocurrencies, and is suitable for various symbols such as BTCUSD, EURUSD, GBPUSD, XAUUSD, and NAS100.
โปรไฟล์อินดิเคเตอร์
รีวิวจากลูกค้า
4.5
รีวิว: 2
5 | 50 % | |
4 | 50 % | |
3 | 0 % | |
2 | 0 % | |
1 | 0 % |
การสนทนา
คำถามที่พบบ่อย
BTCUSD
Forex
Breakout
Indices
EURUSD
Commodities
GBPUSD
NZDUSD
Bollinger
Fibonacci
Scalping
SMC
Crypto
Stocks
XAUUSD
NAS100
USDJPY
VWAP
ผลิตภัณฑ์ที่มีให้บริการผ่าน cTrader Store รวมถึงบอทการเทรด อินดิเคเตอร์ และปลั๊กอิน มีให้บริการโดยนักพัฒนาบุคคลที่สามและมีไว้เพื่อวัตถุประสงค์ในการเข้าถึงข้อมูลและทางเทคนิคเท่านั้น cTrader Store ไม่ใช่โบรกเกอร์และไม่ได้ให้คำแนะนำการลงทุน คำแนะนำส่วนบุคคล หรือการรับประกันผลการดำเนินงานในอนาคต


ราคา
ตั้งแต่ 26/09/2025
16
การขาย