설명
🚀 10,000명 이상의 트레이더들이 이미 우리의 TOP 지표🏆
전문가들이 왜 우리를 선택하는지 알아보세요 – 가장 강력한 도구들이 cTrader(지표, 알고리즘, 그리고 cBots)에서 여러분을 기다립니다.
👉 모든 TOP 시스템을 여기에서 받으세요:
_______________________________________________
📌 시장 구조 지표
· ✅ AdvancedMarket Structure: Bos, Choch, SwinLevels, Order Blocks, 시장 구조& 유동성 탐색기
· 🔄 동적 시장 구조 전환점 분석
· 🧱 오더 블록
· ⚖️ 시장 불균형
· ⛓️ BOS & CHOCH
· 🧠 ICT 파워 오브 3
· 🌀 시장 극성 구역
_______________________________________________
🔚 스마트 종료 시스템
· 📍 트레일링 스마트 알고리즘
_______________________________________________
📐 지그재그 지표
· 🔍 지그재그 가격 유동성 투영
· 🧭 S&R 구조적 지그재그
· ➖ 지그재그
· 🎯 지그재그 극단 추적기
_______________________________________________
🧱 지지 및 저항 지표
· 🟩 스마트트렌드 지지 및 저항선
· 🧱 모든 지지 및 저항 레벨
_______________________________________________
📊 추세 및 채널 지표
· 🔄 자동 추세 채널
· 📊 슈퍼트렌드
· ⚡모멘텀 추세 분석기
· 🧠 적응형 추세 채널
· 💥 채널 돌파 시스템
· 🌈 동적 추세 그라데이션
· ⭐ 프리미엄 SSL 채널
· 🔁 반응형 이동평균
_______________________________________________
💧 거래량 및 유동성 도구
· 🔥 거래량 POC 히트맵
· 📉 레버리지 청산 맵
· 🔍 모멘텀 공정 가치 갭
· 🕒 공정 가치 갭 세션
_______________________________________________
⚡ 모멘텀 및 RSI 지표
· 📈 RSI 추세 트리거
· 🚀 동적 범위 모멘텀
_______________________________________________
🔮 예측 및 투영 도구
· 📈 거래량 기반 시장 흐름 투영기
________________________________________________________________________________________________________
________________________________________________________________________________________________________
맥도날드 패턴 베지에 곡선 🍟
무엇을 위한 것인가요? 🤔
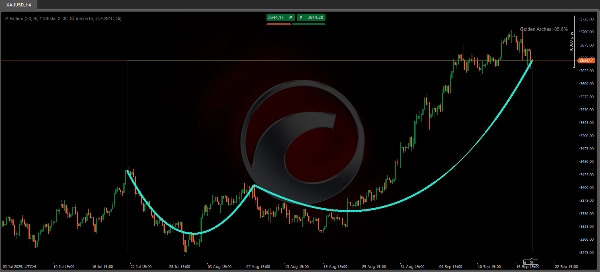
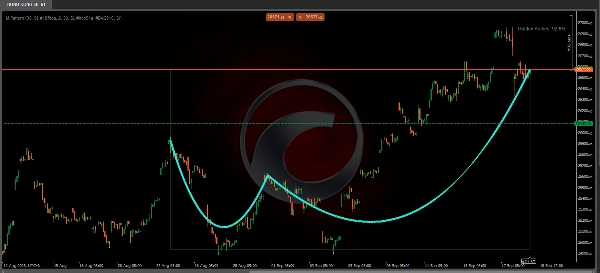
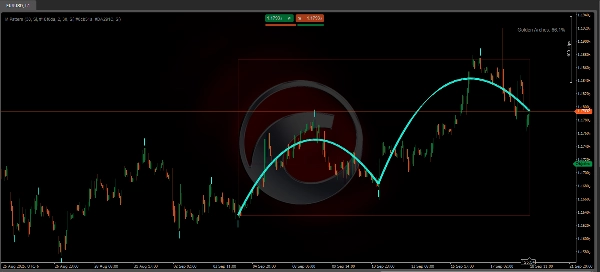
이 "맥도날드 패턴 베지에 곡선" 지표는 베지에 곡선을 사용하여 가격 반전 패턴을 식별하고 시각화하도록 설계되었습니다. 주요 목적은 차트에서 아치 형태(마치 "M" 또는 "W"와 유사한)와 닮은 시장 구조를 감지하는 것으로, 이는 잠재적 추세 변화 🎯를 나타낼 수 있습니다. 또한, 감지된 패턴의 품질을 평가하는 점수 시스템도 포함되어 있습니다.
어떻게 작동하나요? ⚙️
- 피벗 감지:
지표는 지정된 "Lookback Period" 동안 로컬 고점과 저점(피벗)을 식별합니다. 이들은 차트에 원으로 표시됩니다: ⚪ - 베지에 곡선:
최소 5개의 피벗이 감지되면, 지표는 이 점들을 연결하는 두 개의 아치를 베지에 곡선을 사용해 그립니다. 이 아치들은 피벗 간 전환을 부드럽게 하여 쌍 아치("골든 아치") 🏛️와 유사한 시각적 구조를 형성하는 것을 목표로 합니다. - 색상 영역:
활성화된 경우, 첫 번째와 마지막 피벗 사이에 영역이 그려집니다. 이 영역의 색상은 패턴의 방향에 따라 달라집니다: -
- 🟢 녹색: 강세 추세 (마지막 피벗이 더 높을 경우).
- 🔴 빨간색: 약세 추세 (마지막 피벗이 더 낮을 경우).
- 패턴 점수:
아치의 대칭성과 품질을 반영하는 백분율을 계산합니다. 점수가 높을수록 더 잘 정의된 패턴을 의미합니다.
재도색(재플로팅) 되나요? 🔄
네, 이 지표는 재도색됩니다. 이는 새로운 가격 데이터가 들어올 때마다 그리기와 감지가 소급하여 변경될 수 있음을 의미합니다. 이는 잠재적 피벗 형성 후 일정 수의 바를 관찰하여 전환점을 식별하기 때문입니다. 따라서 과거 데이터에서 확정된 아치처럼 보였던 것이 실시간 차트에 적용할 때 조정되거나 사라질 수 있습니다 📊.
기술적 분석에서 보조 도구로 사용할 수 있습니다.
어떻게 사용할 수 있나요? 💡
- 📚 백테스팅 분석:
과거 패턴을 연구하고 다양한 자산이나 시간대에서의 효과를 평가하는 데 유용합니다. - 👁️ 시각적 확인:
다른 분석 도구(예: 지지/저항, 이동평균)와 함께 사용하여 잠재적 반전을 검증할 수 있습니다. - 🎓 교육:
베지에 곡선을 기반으로 한 시장 구조 인식에 도움을 주지만, 실시간 거래에서는 추가 검증이 필요합니다.
제한 사항 및 권장 사항 ⚠️
- 실시간 사용:
재도색되므로, 시장 진입이나 종료를 위한 독립 신호로 사용해서는 안 됩니다. - 최적화:
거짓 신호를 줄이기 위해 자산과 시간대에 맞게 "Lookback Period"를 조정하세요. - 시장 상황:
횡보/박스권 시장보다는 추세 시장에서 더 잘 작동합니다.
중요 참고 사항: 🚨
미래 데이터에 의존하여 확인하기 때문에, 주로 이미 발생한 이벤트(예: 장 시작 후 하락이나 교육용 차트 연습) 분석에 사용해야 하며, 예측이나 실시간 거래 목적으로는 적합하지 않습니다. 혁신적인 접근법이지만, 재도색 특성으로 인한 거짓 신호를 피하기 위해 다른 지표 및 분석과 함께 사용해야 합니다. 백테스팅 연구나 거래 전략에서의 교육적 보조로 이상적입니다.
요약
This tool repaints, meaning its visualizations and detections can change retroactively as new price data arrives, so it is best used for backtesting, educational purposes, or as a complementary aid alongside other technical analysis tools. It is optimized for trending markets and requires adjustment of the lookback period to suit different assets and timeframes. The indicator supports markets including Forex (e.g., EURUSD), commodities (e.g., XAUUSD), and cryptocurrencies (e.g., BTCUSD).