
Descrizione
🚀 Oltre 10.000 trader utilizzano già i nostri MIGLIORI indicatori🏆
Scopri perché i professionisti ci scelgono – gli strumenti più potenti su cTrader (indicatori, algoritmi e cBot) ti stanno aspettando.
👉 Ottieni tutti i nostri sistemi TOP qui:
_______________________________________________
📌 Indicatori di Struttura di Mercato
· ✅ AdvancedMarket Structure: Bos, Choch, SwinLevels, Order Blocks, Market Structure& Liquidity Finder
· 🔄 Analisi Dinamica della Struttura di Mercato dei Punti di Inversione
· 🧱 Order Block
· ⛓️ BOS & CHOCH
· 🧠 ICT Power of 3
· 🌀 Zone di Polarità di Mercato
_______________________________________________
🔚 Sistemi di Uscita Intelligenti
· 📍 Algoritmo Intelligente a Trailing
_______________________________________________
📐 Indicatori ZigZag
· 🔍 Proiezione della Liquidità del Prezzo ZigZag
· ➖ ZigZag
· 🎯 Tracciatore di Estremità Zig-Zag
_______________________________________________
🧱 Indicatori di Supporto e Resistenza
· 🟩 Linee di Supporto e Resistenza SmartTrend
· 🧱 Tutti i Livelli di Supporto e Resistenza
_______________________________________________
📊 Indicatori di Trend e Canale
· 🔄 Canale di Trend Automatico
· 📊 Supertrend
· ⚡Analizzatore di Trend Momentum
· 💥 Sistema di Breakout del Canale
· 🌈 Gradiente di Trend Dinamico
_______________________________________________
💧 Strumenti di Volume e Liquidità
· 📉 Mappa di Liquidazione Leva
_______________________________________________
⚡ Indicatori Momentum e RSI
· 🔎 Bias Multi-Livello delle Candele
Tracciatore
_______________________________________________
🔮 Strumenti di Previsione e Proiezione
· 📐 Previsione Basata su Linreg& ATR
· 📏 Regressione Lineare Fibonacci Multi-timeframe
· 📈 Proiettore di Flusso di Mercato Alimentato dal Volume
______________________________________________________________________________________________
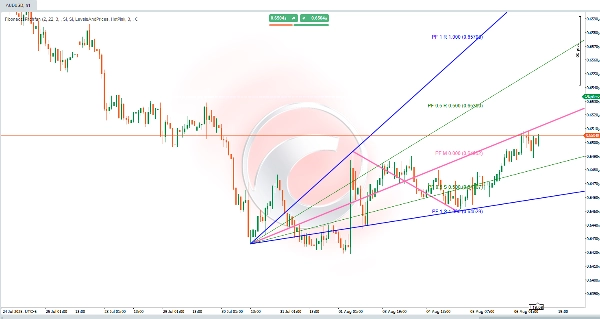
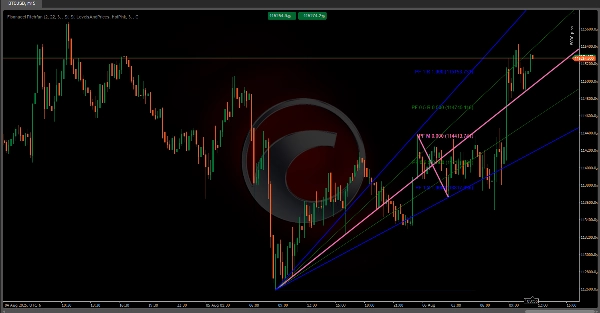
Fibonacci Pitchfan 📊✨
Un indicatore tecnico avanzato che combina rilevamento dei pivot, linee di tendenza dinamiche, e livelli di Fibonacci per creare uno strumento visivo che aiuta i trader a identificare tendenze, zone di supporto/resistenza e potenziali punti di inversione. 🎯 Altamente personalizzabile, si adatta a diversi stili di trading tramite parametri configurabili. Di seguito una spiegazione della sua logica e dei calcoli.
Componenti Principali 🔧
L'indicatore si basa su tre elementi chiave che lavorano insieme:
1. Rilevamento dei Pivot 🔄
- Identifica punti chiave di inversione del prezzo (pivot alti/bassi).
- Utilizza un intervallo di barre definito dall'utente (profondità del pivot) per determinare se una barra è un massimo/minimo significativo rispetto alle barre circostanti.
- Filtra il rumore richiedendo che i pivot superino una soglia di deviazione basata su ATR, assicurando che vengano considerati solo movimenti di prezzo rilevanti.
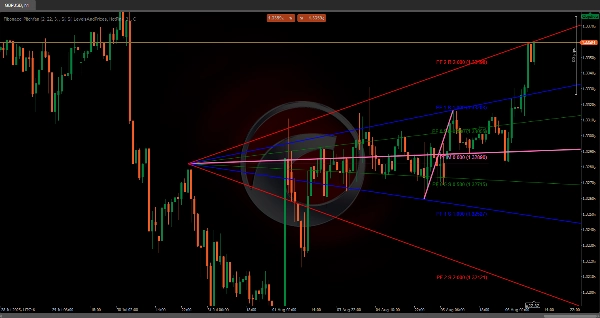
2. TrendFan e Livelli di Fibonacci 📐
- Proietta un ventaglio di linee di tendenza dinamiche da un pivot storico verso il futuro, utilizzando livelli predefiniti (es. 0,25, 0,5, 1,0) per segnare potenziali supporti/resistenze.
- Livelli opzionali di Fibonacci (linee orizzontali) evidenziano ritracciamenti/estensioni tra pivot chiave.
Logica di Calcolo 🧮
1. Identificazione dei Pivot
- Per ogni barra, l'algoritmo esamina un intervallo simmetrico di barre precedenti/successive (basato sulla profondità del pivot).
- Un pivot alto è confermato se il massimo della barra è il più alto nell'intervallo; un pivot basso se il minimo è il più basso.
- La soglia di deviazione (una % di ATR rispetto al prezzo) filtra le fluttuazioni minori, concentrandosi su movimenti di mercato significativi.
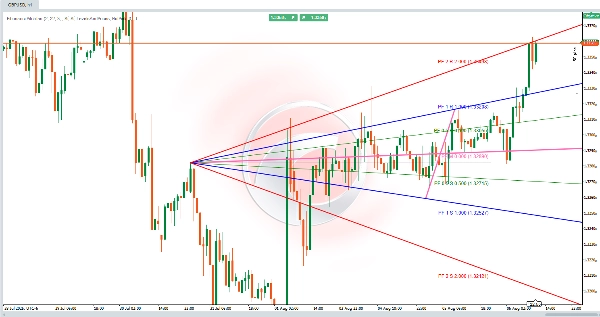
2. Generazione del TrendFan 🌪️
- Un pivot storico di riferimento (configurabile) è abbinato al pivot più recente per formare una linea base.
- Una linea mediana viene tracciata tra di essi, e linee di tendenza proiettate (a livelli predefiniti) si estendono nel futuro, creando un "ventaglio" di zone chiave di prezzo.
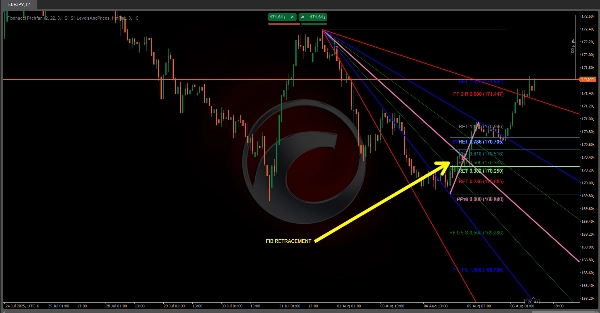
3. Proiezioni di Fibonacci 🔢
- Livelli di ritracciamento (es. 0,236, 0,5, 0,618) segnano potenziali aree di pullback all'interno del movimento di prezzo precedente.
- Livelli di estensione proiettano obiettivi di prezzo oltre l'intervallo iniziale, adattati alla direzione del trend.
- I livelli possono essere invertiti o estesi in base alle impostazioni dell'utente.
Impostazioni Personalizzabili ⚙️
- Soglia di Deviazione: Regola la sensibilità ai movimenti di prezzo (basata su ATR).
- Profondità del Pivot: Definisce l'intervallo di barre per il rilevamento dei pivot (influisce sulla frequenza dei segnali).
- Riferimento Storico: Imposta quanto indietro viene selezionato il pivot iniziale per il TrendFan.
- Visibilità: Attiva/disattiva la visualizzazione di TrendFan/Fibonacci e seleziona i livelli specifici da mostrare.
Conclusione 🏆
Il Fibonacci Pitchfan è uno strumento potente tutto-in-uno per i trader che cercano una visione chiara e dinamica della struttura di mercato. Unendo pivot, linee di tendenza e livelli di Fibonacci, fornisce intuizioni pratiche per anticipare i movimenti di prezzo e prendere decisioni informate. 🚀
Riepilogo
It generates a "TrendFan" by projecting dynamic trendlines from a configurable historical pivot to the latest pivot, creating a fan of key price zones. Optional Fibonacci retracement and extension levels highlight potential pullback areas and price targets, which can be customized or inverted according to user preferences.
Key customizable settings include deviation threshold sensitivity, pivot depth (bar range for pivot detection), historical reference for the initial pivot selection, and visibility options for TrendFan and Fibonacci levels. This tool is suitable for traders seeking actionable insights to anticipate price movements and make informed decisions based on a comprehensive view of market dynamics.


