
Penerangan
Tinggi / Rendah Hari Sebelumnya – Tahap Virgin Ultimate
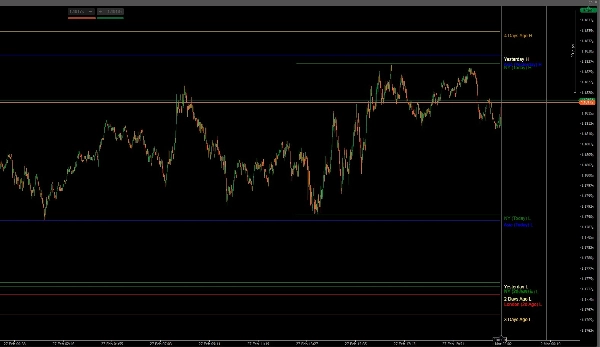
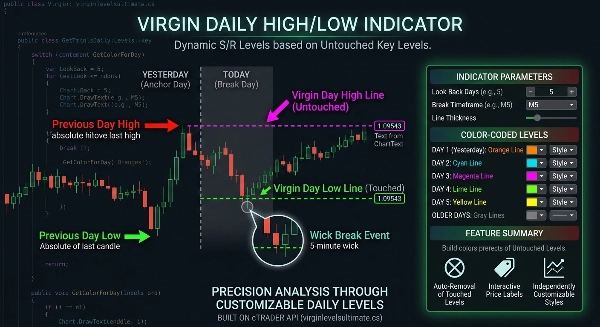
Virgin Levels Ultimate adalah penunjuk penjejakan tahap ketepatan yang secara automatik melakar tinggi dan rendah yang belum disentuh dari hari dagangan sebelumnya dan mengekalkannya pada carta anda sehingga harga memecahkannya.
Dibina untuk pedagang yang memahami bahawa tahap kecairan yang belum disentuh bertindak sebagai magnet untuk harga, alat ini memberi anda rangka kerja yang bersih dan terstruktur untuk pelaksanaan pecahan dan pembalikan.
Kini diperluaskan dengan tinggi/rendah sesi Asia, London, dan New York, serta tahap Mingguan dan Bulanan Sebelumnya, mewujudkan peta kecairan pelbagai jangka masa yang lengkap.
Direka untuk Forex, indeks, emas, dan kripto — merentasi semua jangka masa.
Dagangkan kecairan utama. Berdagang dengan ketepatan.
⚙ Enjin Teras
- Pengesanan automatik tinggi dan rendah harian sebelumnya
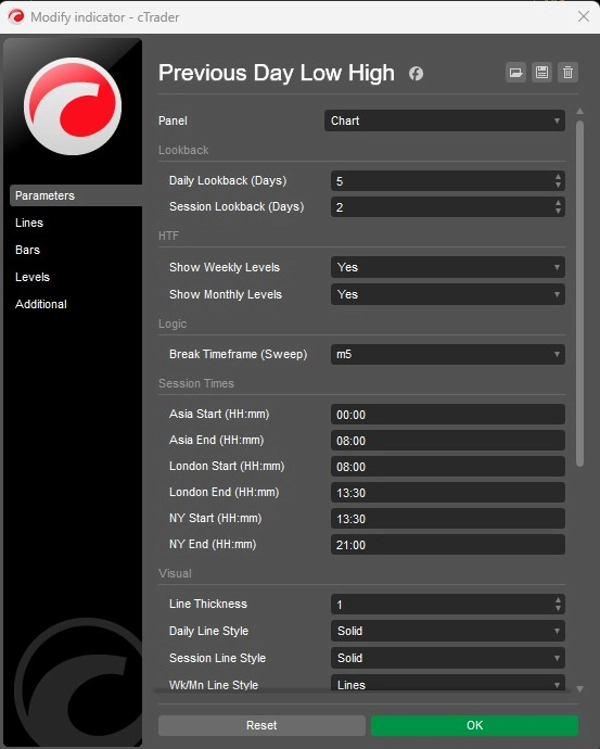
- Tempoh semakan harian yang boleh disesuaikan (jejaki beberapa hari lalu)
- Pengesanan tinggi/rendah sesi Asia, London, dan New York
- Kawalan semakan sesi (jejaki beberapa sesi sebelumnya)
- Tinggi / Rendah Mingguan Sebelumnya (pilihan)
- Tinggi / Rendah Bulanan Sebelumnya (pilihan)
- Tahap hanya diaktifkan dari tempoh dagangan sah berikutnya
- Penghapusan automatik setelah tahap disentuh (tiada kekacauan)
- Pengesanan pecahan berdasarkan jangka masa lebih rendah yang boleh dipilih
- Pengesahan tahap masa nyata
📊 Logik Tahap Virgin
- Melakar hanya tinggi dan rendah yang belum disentuh (virgin)
- Tahap Harian, Sesi, Mingguan, dan Bulanan dipisahkan dengan jelas
- Penjejakan berbilang hari (Hari 1 hingga Hari 5+)
- Penjejakan sesi (Hari ini, Semalam, semakan tersuai)
- Hari-hari lama dibezakan secara visual
- Pemetaan sokongan & rintangan dinamik
- Rangka kerja pecahan berasaskan kecairan
- Struktur konfluens pelbagai jangka masa
🕒 Pengesanan Pecahan Pintar
- Jangka masa pecahan boleh dipilih (contoh, M5, M15, dll.)
- Ketepatan intrahari untuk pembatalan tahap
- Imbas Tinggi/Rendah dari masa pengaktifan sah
- Berfungsi merentasi tahap Harian, Sesi, Mingguan, dan Bulanan
- Berhenti melakar segera selepas sentuhan disahkan
- Logik carta bersih — tiada lebihan sejarah
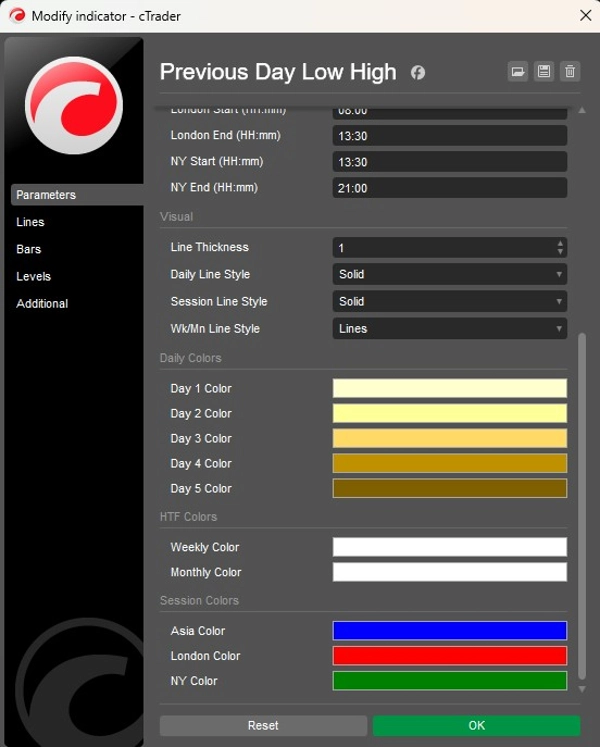
🎨 Penyesuaian Penuh
- Kawalan warna bebas untuk setiap semakan harian
- Warna khusus untuk sesi Asia, London, dan New York
- Warna berasingan untuk tahap Mingguan dan Bulanan
- Gaya garis boleh laras (Harian / Sesi / HTF)
- Tetapan ketebalan tersuai
- Label harga automatik dengan penumpukan pintar (tiada pertindihan)
- Penampilan carta minimalis dan profesional
🎯 Sesuai Untuk
- Pedagang sapuan kecairan
- Pedagang pecahan & palsu
- Pedagang gaya SMC / ICT
- Pedagang berasaskan sesi (Asia, London, NY)
- Pedagang intrahari dan ayunan
- Sistem berasaskan peraturan firma prop
- Pedagang pelbagai aset (Forex, indeks, logam, kripto)
Ringkasan
Key features include automatic detection and plotting of prior highs and lows, customizable lookback periods for days and sessions, real-time validation, and automatic removal of levels once touched to reduce chart clutter. It visually distinguishes older levels and separates daily, session, weekly, and monthly levels with independent color and style customization. The tool supports dynamic support and resistance mapping and provides a liquidity-based breakout framework suitable for Forex, indices, gold, cryptocurrencies, and other markets.
This indicator is suitable for liquidity sweep traders, breakout and fakeout strategies, smart money concept (SMC) and institutional trading (ICT) styles, session-based trading, intraday and swing trading, prop firm rule-based systems, and multi-asset trading. It offers a professional, minimal chart appearance with auto price labels and smart stacking.
Ulasan pelanggan
5 | 100 % | |
4 | 0 % | |
3 | 0 % | |
2 | 0 % | |
1 | 0 % |


