
Descripción
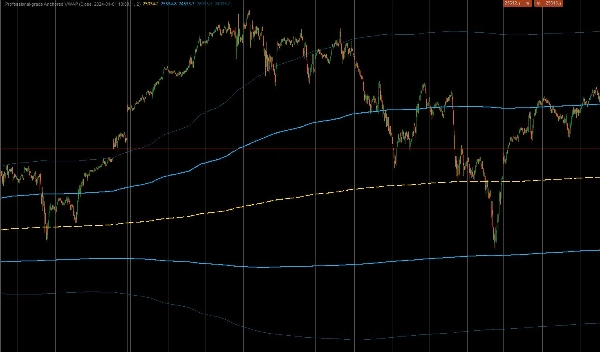
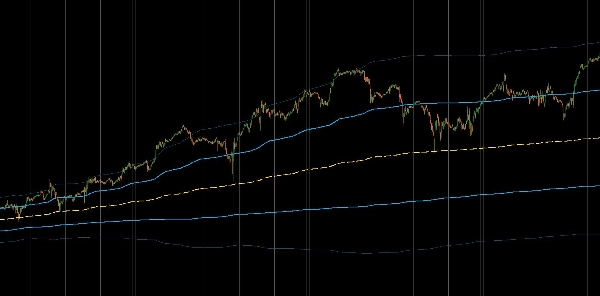
Este es un indicador personalizado de grado profesional para cTrader diseñado para calcular el Precio Promedio Ponderado por Volumen Anclado (AVWAP). A diferencia de los indicadores VWAP estándar que se reinician diariamente, esta herramienta permite a los traders "anclar" el cálculo a un evento específico de alto impacto, como una publicación del IPC, un colapso del mercado o el inicio de una tendencia, proporcionando una visión institucional verdadera del precio promedio desde ese momento. También incluye Bandas de Desviación Estándar Ponderadas por Volumen para identificar acciones de precio sobreextendidas.
1. Cálculo Central y Lógica de Anclaje
- Anclaje Preciso: El indicador utiliza una
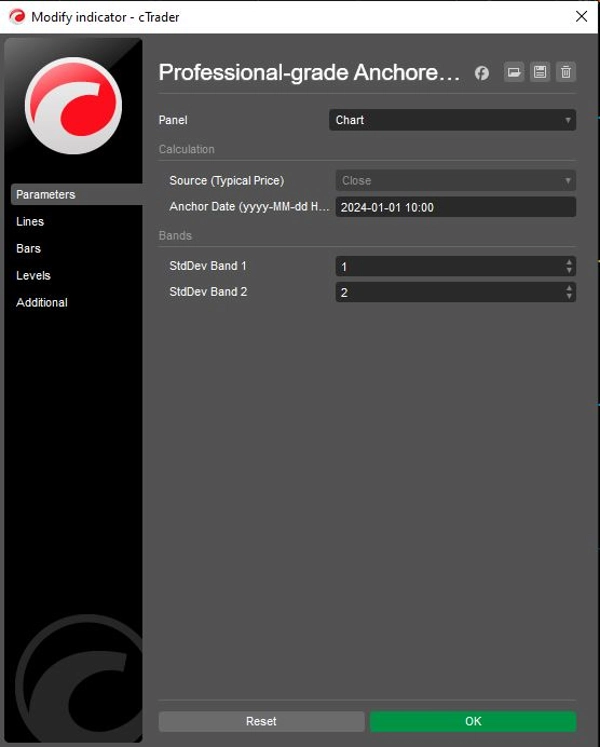
Fecha de Anclajedefinida por el usuario (por ejemplo, "2024-01-01 10:00") para ignorar estrictamente todos los datos anteriores a ese minuto específico. Esto asegura que el precio promedio refleje solo a los participantes involucrados en el movimiento o marco temporal específico actual. - Fórmula Institucional: Calcula el verdadero VWAP usando la suma acumulativa de (Precio × Volumen) dividida por la suma acumulativa de Volumen.
- Fuente de Precio Típico: Por defecto, utiliza el
"Precio Típico" (Alto + Bajo + Cierre) / 3para los cálculos, que es el método estándar usado por algoritmos institucionales para determinar el valor justo, aunque esto puede ajustarse a precios de Apertura o Cierre.
2. Bandas Avanzadas de Volatilidad
Para ayudar a los traders a medir los extremos del mercado, el indicador calcula dos conjuntos de bandas dinámicas basadas en Varianza Ponderada por Volumen:
- Banda 1 (La Zona de Valor): Por defecto es 1.0 Desviación Estándar. Esta zona interna típicamente contiene el "ruido" del valor justo del mercado. Una ruptura de esta zona a menudo señala momentum.
- Banda 2 (La Zona Extrema): Por defecto es 2.0 Desviaciones Estándar. Los precios que alcanzan esta banda externa están estadísticamente sobreextendidos, señalando a menudo oportunidades potenciales de reversión a la media (contrarrestar el movimiento) o agotamiento fuerte de la tendencia.
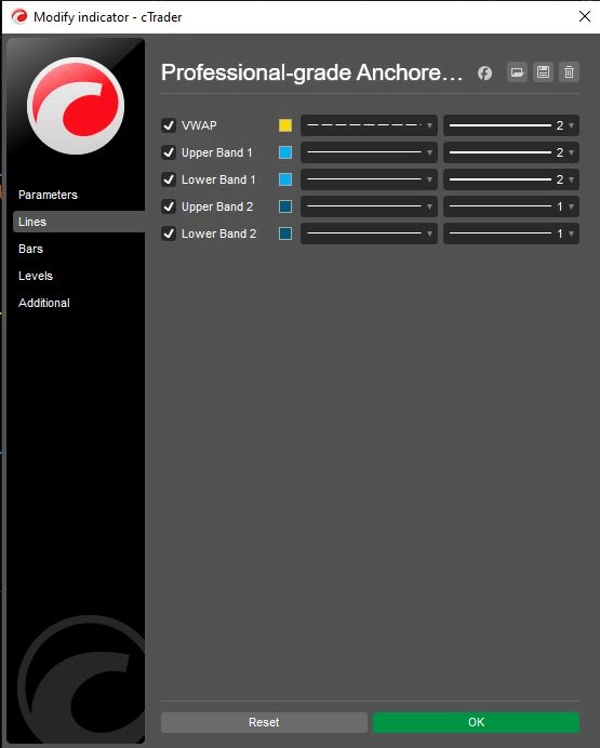
- Control Independiente: Ambas bandas incluyen conmutadores individuales
Mostrar(MostrarBanda1,MostrarBanda2) y multiplicadores de desviación personalizables (Banda1Desv,Banda2Desv), permitiendo gráficos limpios adaptados a estrategias específicas de volatilidad.
3. Lógica Visual y Operativa
- Codificación Estratégica de Colores:
-
- Amarillo (VWAP): Actúa como el "imán" central o línea base de la tendencia.
- Verde Lima (Banda 1): Representa el "Área de Valor" de soporte/resistencia inmediata.
- Rojo (Banda 2): Destaca desviaciones extremas donde aumenta la probabilidad de reversión.
- Preservación del Estado: El código utiliza
IndicatorDataSeriespara variables internas de estado (_cumVol,_cumPV), asegurando que los valores permanezcan precisos durante recálculos históricos y actualizaciones en tiempo real sin errores de repintado.
Resumen del Flujo Lógico
- Inicializar: Analizar la cadena específica de Fecha de Anclaje del usuario en un objeto DateTime del sistema.
- Filtrar Tiempo: Para cada barra, verificar si el tiempo actual es antes del Ancla. Si es así, devolver
NaN(no dibujar nada) y reiniciar los contadores acumulativos a cero. - Acumular Datos: Una vez alcanzado el tiempo de Anclaje, comenzar a sumar el Volumen de la barra actual y (Precio × Volumen) al total acumulado.
- Calcular VWAP: Dividir el Total PV Acumulado por el Total de Volumen Acumulado para obtener la línea VWAP.
- Calcular Varianza: Calcular la varianza ponderada por volumen y derivar la Desviación Estándar.
- Dibujar Bandas: Sumar/Restar la Desviación calculada al VWAP para dibujar las bandas Verde Lima y Roja.
Resumen
Key features include:
- Precision anchoring to a user-specified date and time, ignoring data before that moment.
- Institutional VWAP calculation using cumulative (Price × Volume) divided by cumulative Volume.
- Default use of Typical Price ((High + Low + Close) / 3) for fair value, adjustable to Open or Close prices.
- Two dynamic volatility bands based on volume-weighted variance: Band 1 (1 standard deviation) representing the value zone, and Band 2 (2 standard deviations) indicating extreme price deviations.
- Independent toggles and customizable deviation multipliers for each band.
- Strategic color coding: yellow for VWAP, lime green for Band 1, and red for Band 2.
- Internal state preservation ensures accurate values during historical and real-time updates without repainting.
The indicator supports markets including Forex, indices, commodities, stocks, and cryptocurrencies, and is suitable for various symbols such as BTCUSD, EURUSD, GBPUSD, XAUUSD, and NAS100.
Valoraciones de clientes
5 | 50 % | |
4 | 50 % | |
3 | 0 % | |
2 | 0 % | |
1 | 0 % |


