![Trading product for [Stellar Strategies] BOS Trend 1.0 Indicateur, image 1](https://cdn.ctrader.com/image/webp/6cdec0f1-0e97-4a82-a8a4-2b67aed54d38_25695)
[Stellar Strategies] BOS Trend 1.0
Indicateur
455 téléchargements
Version 1.0, Nov 2024
Windows, Mac
5.0
Avis : 1
![Trading product for [Stellar Strategies] BOS Trend 1.0 Indicateur, image 2](https://cdn.ctrader.com/image/webp/2738d263-76dc-4e6f-a818-7e66349e6883_25696)
![Trading product for [Stellar Strategies] BOS Trend 1.0 Indicateur, image 3](https://cdn.ctrader.com/image/webp/5338cc95-bf3e-4db4-b575-3e935cff8e90_25697)
![Trading product for [Stellar Strategies] BOS Trend 1.0 Indicateur, image 4](https://cdn.ctrader.com/image/webp/59502053-3cfb-4232-b1da-c27ad8852e60_25698)
![Trading product for [Stellar Strategies] BOS Trend 1.0 Indicateur, image 5](https://cdn.ctrader.com/image/webp/e32ea74f-662d-4c30-8571-3b8062b6be90_25699)
![Trading product for [Stellar Strategies] BOS Trend 1.0 Indicateur, image 6](https://cdn.ctrader.com/image/webp/fe0c3dd9-19fe-4833-bd0e-640ccec47e31_25700)
![Trading product for [Stellar Strategies] BOS Trend 1.0 Indicateur, image 7](https://cdn.ctrader.com/image/webp/0fa38032-d41c-4684-a0ec-c9512db0d567_25701)
![Trading product for [Stellar Strategies] BOS Trend 1.0 Indicateur, image 8](https://cdn.ctrader.com/image/webp/10e865d7-9813-4932-ac9b-3b76516518c9_25702)
Description
Le [Stellar Strategies] BOS Trend est un indicateur premium Break of Structure (BOS) multi-échelle conçu pour cAlgo. Il fournit aux traders des informations cruciales sur les tendances du marché en détectant les BOS de tendance haussière et baissière sur plusieurs échelles de temps.
Fonctionnalités :
- Analyse Multi-Échelle : Analyse les mouvements de prix sur différentes échelles de temps (1 min à journalier).
- Échelles de Temps Personnalisables : Activez ou désactivez des échelles de temps spécifiques pour adapter votre analyse.
- Alertes en Temps Réel : Affiche des messages sur le graphique lorsqu’un BOS est détecté.
- Interface Conviviale : Couleur de texte personnalisable pour une meilleure visibilité sur différents fonds de graphique.
Paramètres :
- Période de Rétrogradation (Par défaut : 20) : Le nombre de barres à examiner en arrière lors de la détection du BOS.
- Paramètres des Échelles de Temps :
-
Use 1 Minute Time FrameUse 5 Minute Time FrameUse 15 Minute Time FrameUse 30 Minute Time FrameUse 1 Hour Time FrameUse 4 Hour Time FrameUse Daily Time Frame
- Couleur du Texte (Par défaut : "Yellow") : Définit la couleur des messages BOS.
Comment Utiliser l’Indicateur :
- Ajouter l’Indicateur :
-
- Ouvrez votre plateforme cAlgo.
- Accédez à la section des indicateurs et ajoutez le [Stellar Strategies] BOS Trend à votre graphique.
- Configurer les Paramètres :
-
- Période de Rétrogradation : Ajustez la période de rétrogradation selon votre stratégie de trading (par défaut 20 barres).
- Activer/Désactiver les Échelles de Temps : Sélectionnez les échelles de temps que vous souhaitez analyser en cochant ou décochant les options correspondantes.
- Couleur du Texte : Choisissez une couleur de texte qui contraste bien avec le fond de votre graphique pour une meilleure visibilité.
- Lire les Signaux BOS :
-
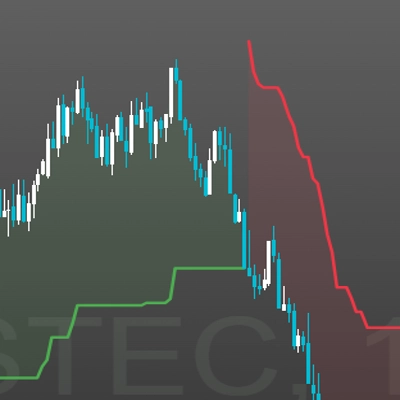
- BOS en Tendance Haussière : Les lignes vertes indiquent une rupture de structure haussière.
- BOS en Tendance Baissière : Les lignes rouges indiquent une rupture de structure baissière.
- Messages BOS : Des messages tels que "Current TF: Uptrend BOS detected" apparaîtront sur le graphique, ainsi que d’autres messages provenant des différentes échelles de temps que vous avez activées.
- Interpréter les Données :
-
- Utilisez les signaux BOS pour identifier des retournements ou des continuations de tendance potentiels.
- Portez attention à l’analyse multi-échelle pour une confirmation plus forte des tendances.
- Personnaliser l’Affichage :
-
- Vous pouvez ajuster la couleur du texte et la position des messages BOS pour une meilleure lisibilité.
Exemple :
Voici un exemple étape par étape de l’utilisation de l’indicateur [Stellar Strategies] BOS Trend :
- Ajouter l’Indicateur :
-
- Ouvrez un graphique dans votre plateforme cAlgo.
- Allez dans
Indicatorset sélectionnez [Stellar Strategies] BOS Trend.
- Configurer les Paramètres :
-
- Réglez la
Lookback Periodà 20. - Activez
Use 1 Minute Time Frame,Use 5 Minute Time Frame, et d’autres échelles de temps selon vos besoins. - Réglez la
Text Colorsur "Yellow" pour une meilleure visibilité.
- Réglez la
- Surveillez le Graphique :
-
- Observez les lignes BOS vertes (tendance haussière) et rouges (tendance baissière) sur votre graphique.
- Recherchez les messages indiquant la détection de BOS sur différentes échelles de temps.
- Agissez :
-
- Utilisez les signaux BOS pour prendre des décisions de trading éclairées basées sur les retournements ou les continuations de tendance.
En suivant ces étapes, vous pouvez utiliser efficacement l’indicateur [Stellar Strategies] BOS Trend pour améliorer votre stratégie de trading grâce à l’analyse BOS multi-échelle.
N’hésitez pas à me faire savoir si vous avez besoin d’aide supplémentaire ou de plus d’informations ! 📈📉
Résumé
Résumé IA
The [Stellar Strategies] BOS Trend is a multi-timeframe Break of Structure (BOS) indicator designed for the cAlgo platform. It identifies key market trend shifts by detecting uptrend and downtrend BOS signals across multiple timeframes ranging from 1 minute to daily charts. Users can customize which timeframes to analyze and adjust the lookback period for BOS detection, with a default of 20 bars. The indicator provides real-time alerts directly on the chart, displaying messages such as "Current TF: Uptrend BOS detected" to inform traders of structural breaks. Visual cues include green lines for uptrend BOS and red lines for downtrend BOS. The interface allows customization of text color to enhance visibility against different chart backgrounds. Traders can use the BOS signals to identify potential trend reversals or continuations, leveraging multi-timeframe analysis for stronger confirmation. The indicator supports flexible configuration to fit various trading strategies and preferences.
Profil de l'indicateur
Avis clients
5.0
Avis : 1
5 | 100 % | |
4 | 0 % | |
3 | 0 % | |
2 | 0 % | |
1 | 0 % |
Avis clients
August 18, 2025
Pros: Automatically detects and marks Break Of Structure points indicating trend shifts. Clean visual arrows and straightforward setup. Cons: No alerts, tooltips, or template saving. May produce noise without volume or market context filters.
Discussion
Questions fréquentes
Les produits disponibles sur cTrader Store, notamment les bots de trading, les indicateurs et les plug-ins, sont fournis par des développeurs tiers et mis à disposition à titre informatif et à des fins d'accès technique uniquement. cTrader Store n'est pas un courtier et ne fournit aucun conseil en investissement, aucune recommandation personnelle ni aucune garantie quant aux performances futures.
Plus de cet auteur
![Logo de "[Stellar Strategies] Market Structure Breakout"](https://cdn.ctrader.com/image/webp/bceec265-3247-4b11-915f-6295a29c106d_28465)
![Logo de "[Stellar Strategies] Market Session Ultimate"](https://cdn.ctrader.com/image/webp/61ffd537-0125-4246-9e72-42eca1791d64_28232)
![Logo de "[Stellar Strategies] Wave Trend Pro"](https://cdn.ctrader.com/image/webp/5f226fbb-245a-41cd-9cdd-b018257d5e6d_28617)
![Logo de "[Stellar Strategies] Inside Bar with Signals"](https://cdn.ctrader.com/image/webp/1d9e8bfa-3b2c-4440-bb37-5856902008a7_30683)
![Logo de "[Stellar Strategies] Linear Regression Candles 1.1"](https://cdn.ctrader.com/image/webp/8b9cff9f-2431-46d2-b0ec-c7f55f4a4a6d_27918)
![Logo de "[Stellar Strategies] Smart ADX"](https://cdn.ctrader.com/image/webp/af13b084-b6f6-41db-b7bc-c7e688b57b05_36929)
![Logo de "[StellarStrategies] Scheduled Trade Executor"](https://cdn.ctrader.com/image/webp/daefc6af-7eca-453e-878d-1b981be2c401_25646)
![Logo de "[Stellar Strategies] VBO"](https://cdn.ctrader.com/image/webp/f034c012-94d4-445a-a01b-febd1cdedaef_36944)
![Logo de "[Stellar Strategies] SP500 Gap Closure cBot 1.0"](https://cdn.ctrader.com/image/webp/92c23fdc-4ad1-4e61-bdb5-c77f6ec8c539_27686)
![Logo de "[Stellar Strategies] Candlestick Patterns Dashboard"](https://cdn.ctrader.com/image/webp/ae8691a5-4884-4553-9bcc-64e16ac82a30_38344)
![Logo de "[Stellar Strategies] QQE"](https://cdn.ctrader.com/image/webp/e702104a-874c-4b39-97dd-fb34518d1015_27712)
![Logo de "[Stellar Strategies] Visual Trend Momentum"](https://cdn.ctrader.com/image/webp/48aee0a5-f10e-4bc8-9671-78e156fcc5df_27548)


Prix
20.46M
Volume tradé
8K
Pips gagnés
25
Ventes
4.34K
Installations gratuites