
Description
▁▂▃▄▅▆▇ █ 10 000+ traders (institutionnels + particuliers) █ ▇▆▅▄▃▂▁
- Choisissez nos meilleurs indicateurs sur cTrader 🏆
- ✨ Précision exclusive pour des résultats supérieurs ✨
- 📈 Nos algorithmes —avec les visuels les mieux notés 🎯—
- ont été mis en œuvre avec succès dans 2 fonds quantitatifs
▁▂▃▄▅▆▇ █████████████████████████████ ▇▆▅▄▃▂▁
_______________________________________________
_______________________________________________
📌 Indicateurs de structure de marché
· 🔄 Analyse dynamique de la structure du marché des points de retournement
· 🧱 Bloc d'ordre
· ⛓️ BOS & CHOCH
· 🧠 ICT Power of 3
· 🌀 Zones de polarité du marché
______________________________________________________________-
Magasin cBots : 🧠 Gold & BTC BreakoutSession Pivots 🧠
_______________________________________________
🔚 Systèmes de sortie intelligents
· 📍 Algorithme intelligent de suivi
_______________________________________________
📐 Indicateurs ZigZag
· 🔍 Projection de liquidité des prix ZigZag
· ➖ ZigZag
_______________________________________________
🧱 Indicateurs de support et de résistance
· 🟩 Lignes de support et de résistance SmartTrend
· 🧱 Tous les niveaux de support et de résistance
_______________________________________________
📊 Indicateurs de tendance et de canal
· 🔄 Canal de tendance automatique
· 📊 Supertrend
· ⚡Analyseur de tendance Momentum
· 🧠 Canal de tendance adaptatif
· 💥 Système de cassure de canal
· 🌈 Gradient de tendance dynamique
_______________________________________________
💧 Outils de volume et de liquidité
· 🔥 Carte thermique POC de volume
· 📉 Carte de liquidation à effet de levier
· 🔍 Écart de valeur équitable Momentum
· 🕒 Sessions d'écart de valeur équitable
_______________________________________________
⚡ Indicateurs Momentum & RSI
· 📈 Déclencheur de tendance RSI
· 🚀 Momentum de plage dynamique
· 🔎 Suivi de biais de chandelle multi-niveaux
_______________________________________________
🔮 Outils de prédiction et de projection
· 📐 Prédiction basée sur Linreg & ATR
· 📏 Régression linéaire Fibonacci Multi-échelles
· 📈 Projecteur de flux de marché alimenté par le volume
______________________________________________________________________________________________________
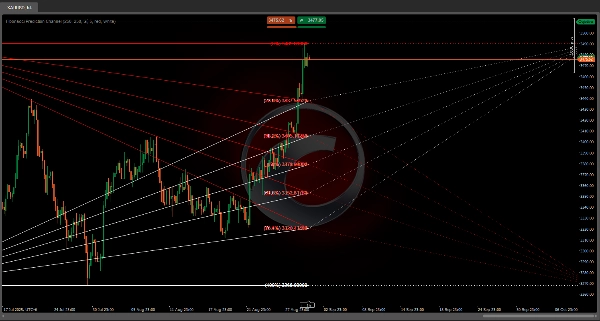
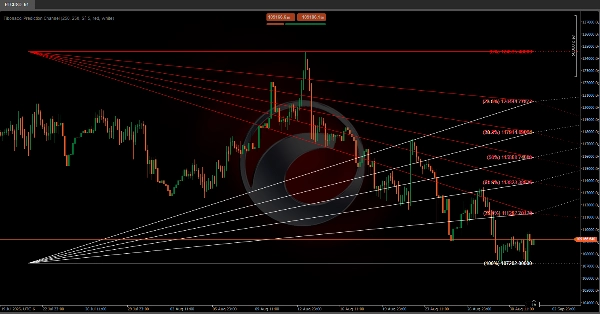
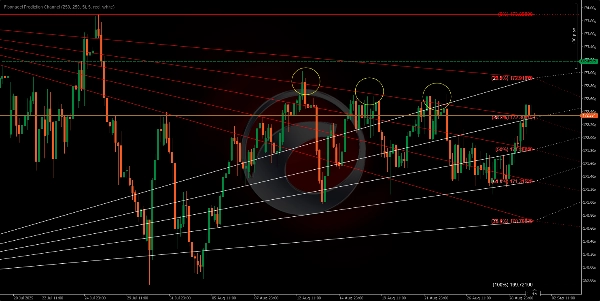
Cet algorithme est conçu pour tracer un canal de prédiction futur basé sur Fibonacci niveaux de retracement 📊✨. Les lignes de Fibonacci créent une série de canaux parallèles entre chaque paire de niveaux consécutifs. Ces canaux peuvent être interprétés comme des plages dans lesquelles le prix est censé fluctuer 📈📉, générant un cône visuel où le prix interagira 🎯. Si un niveau est franchi ⚡, nous passerons au suivant.
Ces niveaux, que nous projetons dans le futur, agissent également comme support et résistance 🛡️⚔️, créant des canaux visuels sur le graphique qui peuvent nous aider à anticiper et planifier des actions 🧠✅ en fonction de la façon dont le prix a réagi à ces niveaux dans le passé.
Nous pouvons nous attendre à ce que le prix réagisse à l'approche de ces lignes 🔍, potentiellement rebondissant à l'intérieur du canal 🔄 ou, s'il y a suffisamment de momentum 🚀, franchissant les lignes pour passer au canal suivant.
Les niveaux projetés vers la droite ➡️🗓️ ne sont pas basés sur de nouvelles données de prix mais sur l'action passée du prix ⏳. Ils s'étendent dans le futur comme une sorte de "carte" 🗺️ pour les réactions potentielles futures du prix.
Barres historiques ⏰ : Détermine combien de périodes de prix passées seront prises en compte lors du calcul des niveaux de retracement de Fibonacci.


