
Description
📈 RSI Stochastique
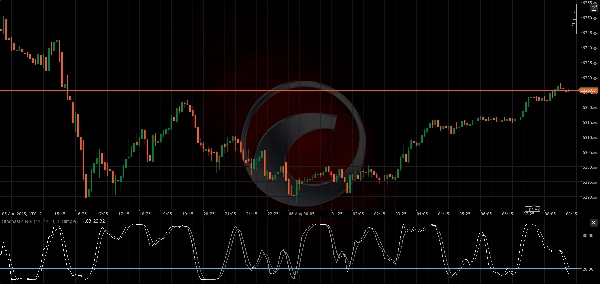
L'indicateur RSI Stochastique est un oscillateur de momentum qui applique la formule stochastique aux valeurs du RSI plutôt qu'au prix, ce qui en fait un indicateur de seconde dérivée. Il est particulièrement utile pour identifier les conditions de surachat et de survente avec une sensibilité plus élevée que le RSI standard.
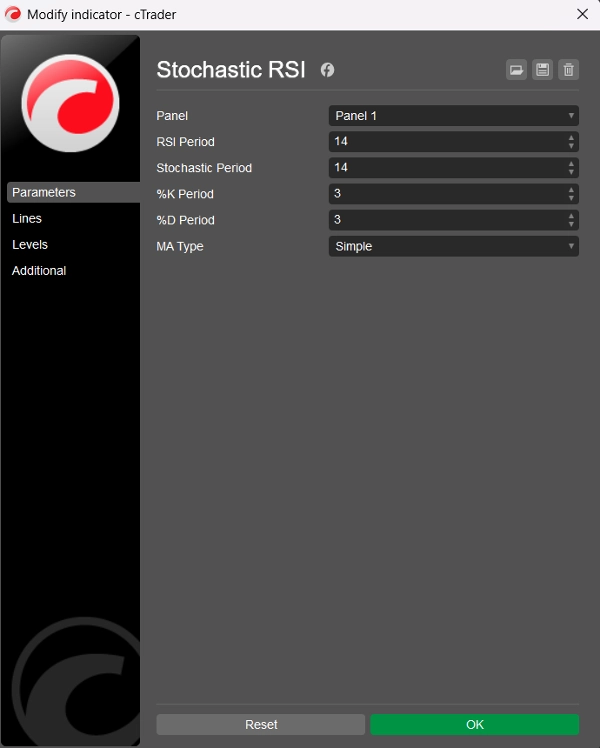
🛠️ Paramètres
Période RSI : La période de retour utilisée pour calculer le RSI de base (par défaut = 14)
Période Stochastique : La période de retour appliquée aux valeurs du RSI pour calculer le RSI Stochastique (par défaut = 14)
Période %K : La période de lissage pour la ligne %K (par défaut = 3)
Période %D : La période de lissage pour la ligne %D (par défaut = 3)
Type de MA : Type de moyenne mobile pour le lissage : choix parmi 11 types (par défaut = Simple)
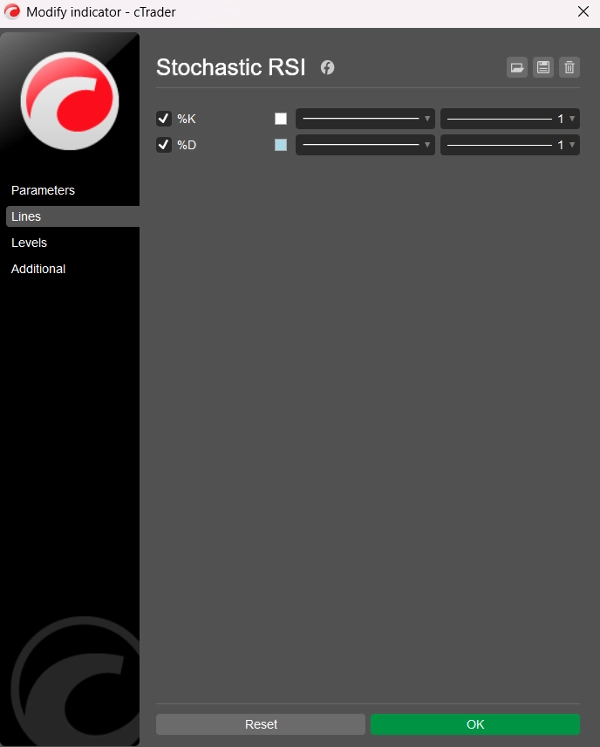
📊 Lignes de sortie
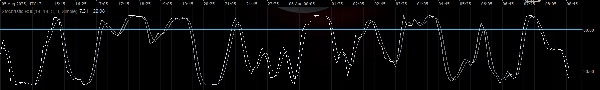
- Ligne %K : RSI Stochastique lissé (blanc)
- Ligne %D : Moyenne mobile lissée de %K (bleu clair)
Les deux lignes oscillent entre 0 et 100, permettant des lectures claires de surachat et de survente.
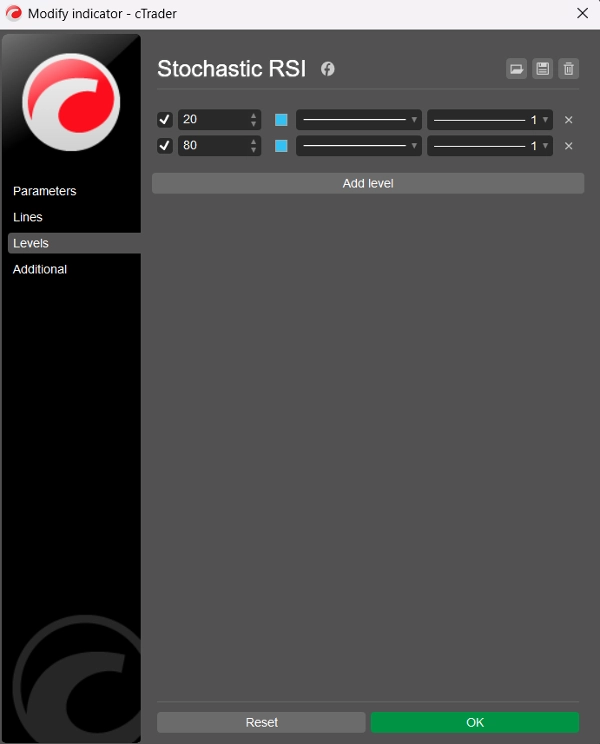
⚠️ Niveaux suggérés
Bien que l'indicateur n'affiche pas de niveaux statiques par défaut, il est recommandé aux utilisateurs de les ajouter manuellement via l'onglet “Niveaux” dans cTrader :
- Niveau 80 → Surachat
- Niveau 20 → Survente
Ces niveaux fonctionnent de manière similaire à l'oscillateur stochastique traditionnel mais appliqués au comportement du RSI, rendant les signaux plus nets et souvent plus rapides.
🧠 Comment utiliser
- Surachat (>80) : Peut indiquer que le prix est trop étendu à la hausse — potentiel de retournement ou de consolidation.
- Survente (<20) : Peut signaler que le prix est survendu — rebond possible ou inversion de tendance.
- Croisements %K et %D : Peuvent être utilisés de manière similaire au Stochastique ou au MACD — un croisement haussier en dessous de 20 ou un croisement baissier au-dessus de 80 peut être exploitable.
🏷️ Notes
- Conçu pour cTrader en utilisant C# et l'API Automate
- Propre, efficace et personnalisable avec 11 types de moyennes mobiles
- Code et logique par BlueRocketBots & ChatGPT (OpenAI)
- Code propre (99 lignes au total ; 54 lignes de code, 27 lignes de texte, 18 lignes vides)
- Version améliorée V2
- Gratuit !
Résumé
Key parameters include the RSI Period (default 14), Stochastic Period (default 14), %K and %D smoothing periods (default 3 each), and a choice among 11 moving average types for smoothing (default is Simple). The indicator outputs two lines: the %K line (smoothed Stochastic RSI) and the %D line (smoothed moving average of %K), both oscillating between 0 and 100.
Suggested manual levels for interpretation are 80 (overbought) and 20 (oversold). Traders may use these levels along with %K and %D crossovers to identify potential price reversals or consolidations. For example, a bullish crossover below 20 or a bearish crossover above 80 can signal actionable market moves.
The indicator is implemented in clean, efficient C# code using the Automate API, allowing customization and integration within cTrader.


