
Description
🚀 Plus de 10 000 traders utilisent déjà nos MEILLEURS indicateurs🏆
👉 Obtenez tous nos MEILLEURS systèmes ici :
_______________________________________________
📌 Indicateurs de Structure de Marché
· ✅ AdvancedMarket Structure : Bos, Choch, SwinLevels, Order Blocks, Market Structure& Liquidity Finder
· 🔄 Analyse Dynamique de la Structure du Marché des Points de Renversement
· 🧱 Order Block
· ⛓️ BOS & CHOCH
· 🧠 ICT Power of 3
· 🌀 Zones de Polarité du Marché
_______________________________________________
🔚 Systèmes de Sortie Intelligents
· 📍 Algorithme Intelligent de Trailing
_______________________________________________
📐 Indicateurs ZigZag
· 🔍 Projection de Liquidité des Prix ZigZag
· ➖ ZigZag
· 🎯 Traceur d'Extrémité Zig-Zag
_______________________________________________
🧱 Indicateurs de Support & Résistance
· 🟩 Lignes de Support & Résistance SmartTrend
· 🧱 Tous les Niveaux de Support et Résistance
_______________________________________________
📊 Indicateurs de Tendance & de Canal
· 🔄 Canal de Tendance Automatique
· 📊 Supertrend
· ⚡Analyseur de Tendance Momentum
· 🧠 Canal de Tendance Adaptatif
· 💥 Système de Rupture de Canal
· 🌈 Gradient de Tendance Dynamique
_______________________________________________
💧 Outils de Volume & de Liquidité
· 🔥 Carte Thermique Volume POC
· 📉 Carte de Liquidation à Effet de Levier
· 🕒 Sessions de Fair Value Gap
_______________________________________________
⚡ Indicateurs Momentum & RSI
· 📈 Déclencheur de Tendance RSI
· 🚀 Momentum de Plage Dynamique
· 🔎 Biais de Chandelle Multi-Niveaux
Traceur
_______________________________________________
🔮 Outils de Prédiction & de Projection
· 📐 Prédiction Basée sur Linreg& ATR
· 📏 Régression Linéaire Fibonacci Multi-échelles
· 📈 Projecteur de Flux de Marché Alimenté par le Volume
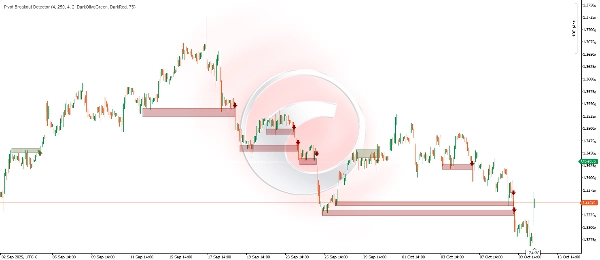
📊 Détecteur de Rupture de Pivot
🎯 **Qu'est-ce que c'est et à quoi ça sert ?**
https://ctrader.chartshots.net/c/68e935cb9f52a
Le Détecteur de Rupture de Pivot est un indicateur technique avancé conçu pour identifier automatiquement les ruptures significatives des zones de consolidation des prix. Cet indicateur analyse le comportement historique du marché pour détecter les zones où le prix a "rebondi" à plusieurs reprises (créant une résistance ou un support) et vous alerte lorsqu'une rupture avec momentum se produit enfin.
**Utilité Principale :**
• Identifier les opportunités de trading lors de ruptures confirmées
• Éviter les fausses ruptures grâce à une validation par multiples contacts
• Visualiser les zones critiques dynamiques de support et résistance
• Capturer les mouvements explosifs après les consolidations
________________________________________
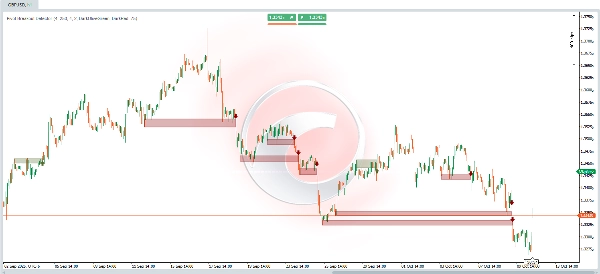
🔍 **Comment ça fonctionne ? - La logique sous-jacente**
**Phase 1 : Détection des Pivots Significatifs**
https://ctrader.chartshots.net/c/68e9368eb6e7c
L'indicateur scanne constamment le graphique à la recherche de points pivots - des hauts et bas locaux qui représentent les endroits où le prix a changé de direction. Ces pivots sont fondamentaux car ils marquent des niveaux où il y avait historiquement un intérêt acheteur ou vendeur.
**Phase 2 : Identification des Zones de Consolidation**
Une fois les pivots détectés, l'indicateur regroupe ceux qui sont proches les uns des autres (dans un seuil configurable). Lorsque plusieurs pivots sont concentrés dans une plage de prix étroite, cela indique une zone de consolidation - une zone où le prix a été rejeté à plusieurs reprises.
**Phase 3 : Confirmation de la Rupture**
L'indicateur attend patiemment que le prix parvienne à :
1. Clore au-dessus (rupture haussière) ou en dessous (rupture baissière) de la zone identifiée
2. Le faire avec une bougie directionnelle forte (clôture éloignée de l'ouverture)
3. Dépasser le plus haut/bas récent à court terme
**Phase 4 : Validation Finale**
Avant de générer le signal, il vérifie que :
• Il y a suffisamment de "touches" précédentes dans la zone (minimum configurable)
• Le prix n'a pas récemment dépassé ce niveau
• L'ouverture de la bougie de rupture est dans la plage valide
________________________________________
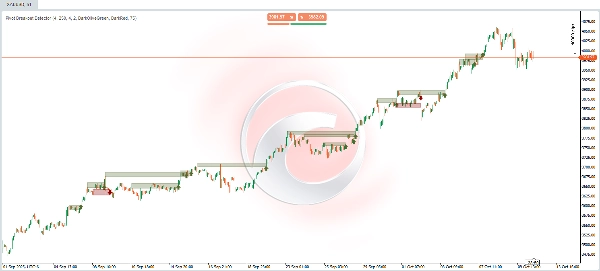
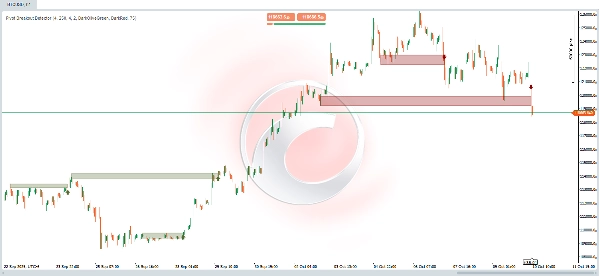
📈 **Interprétation Visuelle**
**Éléments sur le Graphique :**
🟢 **Rectangles Vert Olive (Rupture Haussière)**
• Zone verte ombrée : Représente la zone de résistance qui a été dépassée
• Bordures supérieure et inférieure : Délimitent la zone de consolidation précédente
• Extension horizontale : Montre depuis quand la zone s'est formée jusqu'au moment de la rupture
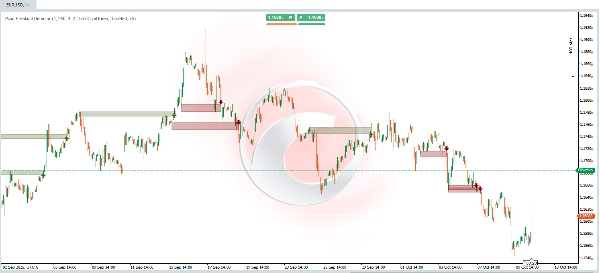
🔴 **Rectangles Rouge Foncé (Rupture Baissière)**
• Zone rouge ombrée : Représente la zone de support qui a été cassée
• Fonction : Identique aux rectangles verts mais pour les mouvements baissiers
⬆️ **Flèche Verte Montante**
• Emplacement : Sous la bougie qui a confirmé la rupture haussière
• Signification : Signal potentiel d'entrée longue (achat)
• Interprétation : Le prix a cassé la résistance avec force
⬇️ **Flèche Rouge Descendante**
• Emplacement : Au-dessus de la bougie qui a confirmé la rupture baissière
• Signification : Signal potentiel d'entrée courte (vente)
• Interprétation : Le prix a cassé le support avec force
________________________________________
⚙️ **Paramètres Configurables**
1. **Longueur de Détection des Swings (Par défaut : 4)**
• Ce qu'il contrôle : La période d'analyse pour détecter les pivots significatifs
• Valeurs basses (2-3) : Détecte des pivots plus petits et plus fréquents, générant plus de signaux mais potentiellement plus de faux
• Valeurs élevées (7-10) : Détecte uniquement les pivots majeurs et plus fiables, générant moins de signaux mais de meilleure qualité
• Recommandation : 4 pour le trading quotidien, 8-10 pour le swing trading
2. **Barres d'Historique de Zone (Par défaut : 250)**
• Ce qu'il contrôle : Combien de chandelles en arrière l'indicateur "se souvient" des pivots pour former les zones
• Valeurs basses (30-100) : Se concentre sur les zones récentes, plus réactif aux changements de structure
• Valeurs élevées (200-300) : Considère les zones historiques plus anciennes, utile pour identifier les niveaux à long terme
• Recommandation : 150-200 pour les unités de temps intraday, 250-300 pour le quotidien ou plus
3. **Pourcentage de Largeur de Zone (Par défaut : 4%)**
• Ce qu'il contrôle : L'épaisseur de la "zone de tolérance" pour regrouper les pivots en une zone
• Valeurs basses (1-2%) : Zones très précises, nécessite plusieurs contacts presque exacts
• Valeurs élevées (5-8%) : Zones plus larges, plus permissives lors du regroupement des niveaux proches
• Recommandation : 2-3% pour les instruments à faible volatilité (principaux forex), 4-6% pour les cryptomonnaies
4. **Touches Minimales de Swing (Par défaut : 2)**
• Ce qu'il contrôle : Nombre minimum de fois que le prix doit avoir "testé" la zone avant de la considérer valide
• Valeurs basses (1-2) : Plus de signaux, incluant des zones moins établies
• Valeurs élevées (3-5) : Uniquement les zones fortement confirmées, moins de signaux mais plus fiables
• Recommandation : 2 pour le trading actif, 3-4 pour des positions plus conservatrices
________________________________________
📊 **Exemples Pratiques**
🔵 **Exemple de Rupture Haussière**
**Contexte Précédent :** Le prix a oscillé pendant plusieurs sessions entre 48,50 $ et 49,20 $. Pendant cette période de consolidation, le prix a tenté de dépasser le niveau de 49,00 $ à trois reprises distinctes, mais a été rejeté à chaque fois, créant des pivots hauts pratiquement au même niveau.
**Formation de la Zone :** L'indicateur identifie automatiquement ces trois pivots hauts concentrés entre 48,90 $ et 49,10 $, créant une "zone de résistance" bien définie. Cette zone est dessinée sous forme d'un rectangle vert olive semi-transparent qui s'étend horizontalement du premier contact jusqu'à présent.
**Moment de la Rupture :** Lors de la session actuelle, le prix ouvre à 48,80 $, monte fortement et clôture à 49,35 $. Cette bougie remplit tous les critères :
• ✅ Clôture au-dessus de la zone de résistance (49,10 $)
• ✅ C'est une bougie haussière forte (clôture bien au-dessus de l'ouverture)
• ✅ Dépasse le plus haut des 4 bougies précédentes
• ✅ La zone avait au moins 2-3 contacts confirmés
**Signal Généré :** Une flèche verte pointant vers le haut apparaît sous la bougie de rupture, et le rectangle vert olive "se ferme" à ce moment, montrant visuellement toute la structure : de la formation de la résistance à sa rupture.
**Interprétation du Trader :** C'est un signal d'achat potentiel. La rupture suggère que les acheteurs ont finalement surmonté la résistance qui retenait le prix, et un mouvement haussier plus soutenu pourrait commencer. Les traders peuvent envisager :
• Entrée longue à la clôture de la bougie ou lors d'un repli vers la zone cassée (maintenant support)
• Stop loss sous la zone (48,70 $)
• Objectif basé sur la hauteur de la zone projetée vers le haut
________________________________________
🔴 **Exemple de Rupture Baissière**
**Contexte Précédent :** Le prix est en phase de distribution autour de 102,00 $ depuis presque deux semaines. À quatre reprises différentes, le prix a tenté de tomber sous 101,50 $ mais a été soutenu par les acheteurs, créant des pivots bas dans une zone très étroite.
**Formation de la Zone :** L'indicateur détecte ces quatre pivots bas regroupés entre 101,40 $ et 101,70 $, identifiant une "zone de support" institutionnelle claire. La zone est marquée par un rectangle rouge semi-transparent qui documente toute l'histoire de la défense à ce niveau.
**Moment de la Rupture :** Lors d'une session volatile, le prix ouvre à 101,80 $, des nouvelles négatives impactent le marché, et le prix s'effondre en clôturant à 100,95 $. Cette bougie de rupture présente :
• ✅ Clôture clairement en dessous de la zone de support (101,40 $)
• ✅ C'est une bougie baissière puissante (clôture bien en dessous de l'ouverture)
• ✅ Casse le plus bas des 4 sessions précédentes
• ✅ Le support avait été testé 4 fois auparavant
**Signal Généré :** Une flèche rouge pointant vers le bas apparaît au-dessus de la bougie de rupture. Le rectangle rouge foncé est complété, documentant visuellement toute la période de formation et le point exact d'effondrement du support.
**Interprétation du Trader :** C'est un signal de vente potentiel. La rupture indique que les vendeurs ont finalement cassé le plancher qui soutenait le prix, suggérant qu'une tendance baissière pourrait se poursuivre. Les considérations incluent :
• Entrée courte à la clôture ou lors d'un repli raté vers la zone cassée (maintenant résistance)
• Stop loss au-dessus de la zone (102,00 $)
• Objectif calculé en projetant la hauteur de la zone vers le bas
________________________________________
💡 **Conseils d'Utilisation**
✅ **Bonnes Pratiques :**
1. Confirmer avec le volume : Les ruptures authentiques sont généralement accompagnées d'une augmentation du volume
2. Contexte de tendance : Les ruptures dans la direction de la tendance majeure ont une probabilité de succès plus élevée
3. Temps d'attente : Tous les signaux ne doivent pas être tradés immédiatement ; attendre une confirmation supplémentaire si nécessaire
4. Gestion du risque : Utiliser toujours un stop loss basé sur la structure de la zone cassée
Résumé
Key features include:
- Automatic detection of significant pivot points and consolidation zones.
- Breakout confirmation based on candle strength and price action.
- Validation requiring multiple prior touches of the zone to reduce false signals.
- Visual cues on the chart: olive green rectangles and upward arrows for bullish breakouts; dark red rectangles and downward arrows for bearish breakouts.
- Configurable parameters such as swing detection length, zone history depth, zone width, and minimum touches to tailor sensitivity and reliability.
The indicator supports various markets including Forex, cryptocurrencies, stocks, and major symbols like BTCUSD, EURUSD, GBPUSD, XAUUSD, and NAS100. It aids traders in spotting confirmed breakout opportunities, visualizing critical price levels, and managing risk with structural stop-loss placement.


