
Description de l'indicateur :
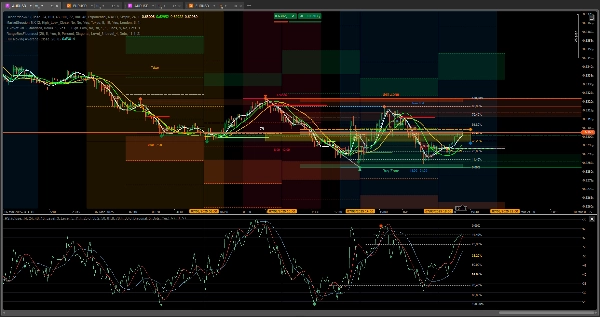
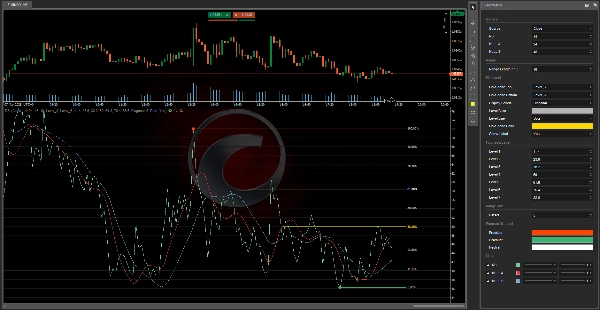
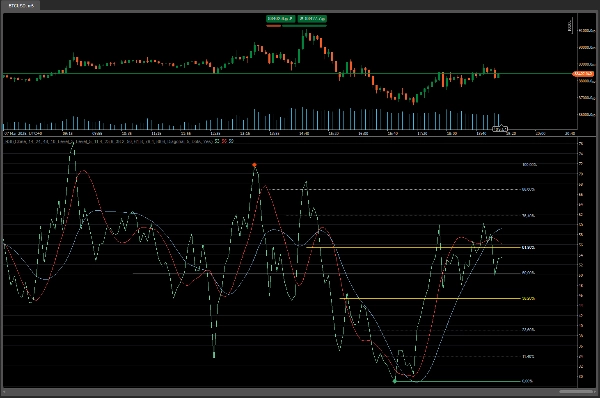
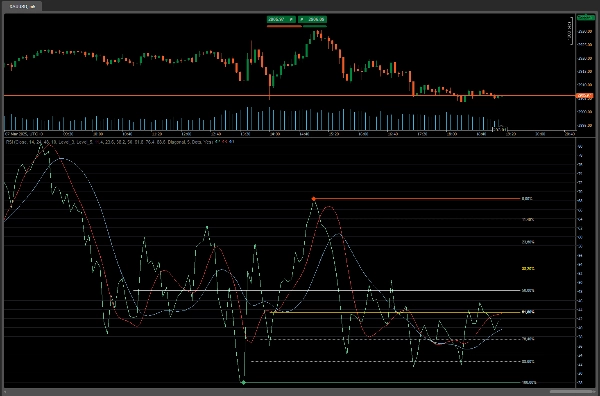
🎯 Indicateur RSI avec niveaux de Fibonacci et moyennes mobiles Hull 🚀
Vous souhaitez améliorer votre analyse technique ? Cet indicateur est fait pour vous ! Il combine le meilleur de trois outils puissants : le RSI (Relative Strength Index), niveaux de Fibonacci, et moyennes mobiles Hull pour vous offrir une vue complète et précise du marché.
Caractéristiques principales :
- RSI avec niveaux de Fibonacci :
-
- Identifie les zones clés de support et résistance basées sur les niveaux de Fibonacci.
- Aide à détecter les potentielles inversions et continuations avec une plus grande précision.
- Moyennes mobiles Hull :
-
- Comprend deux moyennes mobiles Hull (Hull A et Hull B) pour filtrer le bruit du marché et capturer les tendances plus efficacement.
- Fournit des signaux clairs d’ entrée et sortie basés sur les croisements et les changements de direction.
- Zones de changement de tendance :
-
- Met en évidence les zones critiques où un changement de tendance est probable, vous aidant à anticiper des mouvements importants.
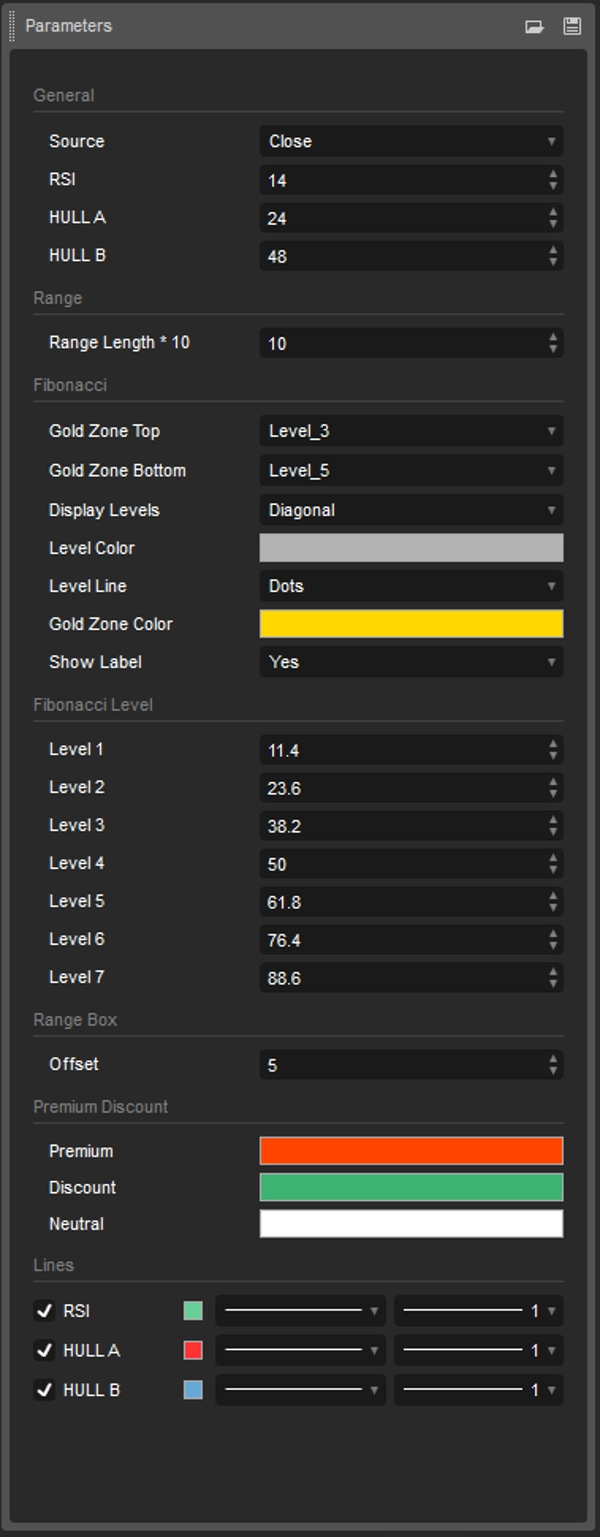
- Personnalisation complète :
-
- Ajustez les niveaux de Fibonacci, les couleurs et les styles de ligne selon vos préférences.
- Configurez les moyennes mobiles Hull pour correspondre à votre stratégie de trading.
- Visualisation claire :
-
- Icônes et lignes de tendance bien définies pour une interprétation rapide et facile.
- Étiquettes optionnelles pour afficher les niveaux de Fibonacci en pourcentages.
Avantages pour les traders :
- Plus grande précision : Combine le RSI avec les niveaux de Fibonacci et les moyennes mobiles Hull pour des signaux plus fiables.
- Gain de temps : Pas besoin de superposer plusieurs indicateurs ; tout est intégré dans un seul outil.
- Polyvalence : Fonctionne sur n’importe quelle période et marché (forex, actions, cryptomonnaies, etc.).
- Facilité d’utilisation : Conçu pour les traders de tous niveaux, des débutants aux experts.
Pourquoi télécharger cet indicateur ?
- Innovant : Une combinaison unique d’outils classiques et modernes que vous ne trouverez pas dans d’autres indicateurs.
- Efficace : Vous aide à identifier les opportunités de trading avec plus de clarté et de confiance.
Comment l’utiliser :
- Identifier la tendance : Utilisez les moyennes mobiles Hull pour déterminer la direction du marché.
- Rechercher les signaux RSI : Vérifiez si le RSI est en situation de surachat ou de survente près des niveaux de Fibonacci.
- Confirmer avec Fibonacci : Utilisez les niveaux de Fibonacci pour identifier les zones clés de support et de résistance.
- Prendre des décisions éclairées : Entrez ou sortez des trades avec plus de confiance grâce à des signaux clairs et précis.
Téléchargez maintenant et améliorez votre trading !
Ne perdez plus de temps à analyser les graphiques manuellement. Avec cet indicateur, vous aurez tout ce dont vous avez besoin en un seul endroit. Rendez votre trading plus efficace et rentable !
Et avec ces deux outils, vous pouvez arrêter de vous inquiéter de ce que le marché va faire, d’un simple coup d’œil vous saurez – acheter ou vendre et passer à une autre tâche.
RangeBoxFibonacci : https://ctrader.com/products/526?u=VIZAINT
OrderPrice-V3 : https://ctrader.com/products/397?u=VIZAINT
Et pour choisir
NTMPICLL https://ctrader.com/products/327?u=VIZAINT
MacdVolume https://ctrader.com/products/267?u=VIZAINT
MarketSession-MX : https://ctrader.com/products/525?u=VIZAINT
5 | 100 % | |
4 | 0 % | |
3 | 0 % | |
2 | 0 % | |
1 | 0 % |


![Logo de "[Stellar Strategies] Market Session Ultimate"](https://cdn.ctrader.com/image/webp/61ffd537-0125-4246-9e72-42eca1791d64_28232)
