
Description
Auto Fibonacci pour cTrader
Identifiez automatiquement les niveaux de prix clés — entièrement personnalisable selon votre stratégie.
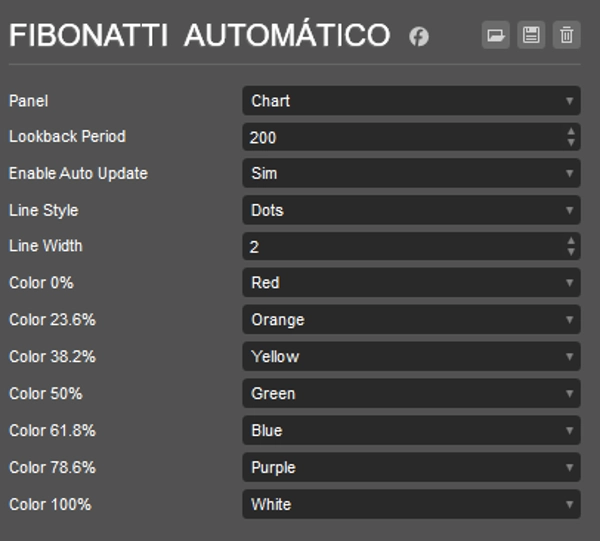
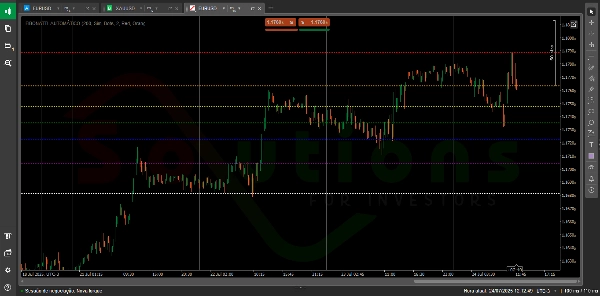
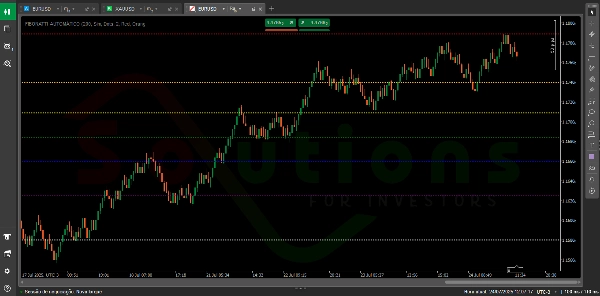
Auto Fibonacci est un indicateur intelligent et flexible qui trace automatiquement les niveaux de retracement de Fibonacci basés sur les prix les plus hauts et les plus bas sur une période définie par l'utilisateur. Ce qui le distingue, c’est sa personnalisation complète : personnalisez la couleur, le style de ligne et l’épaisseur de chaque niveau de Fibonacci pour correspondre à vos préférences visuelles et à votre stratégie de trading. Il offre également des mises à jour en temps réel, de sorte que votre graphique reflète toujours la dernière évolution des prix — aucun ajustement manuel nécessaire.
Résumé
Avis clients
5 | 100 % | |
4 | 0 % | |
3 | 0 % | |
2 | 0 % | |
1 | 0 % |


