
Présentation de l’indice True Strength (TSI), un outil puissant conçu pour améliorer votre stratégie de trading en fournissant des informations claires sur le momentum du marché et la force de la tendance.
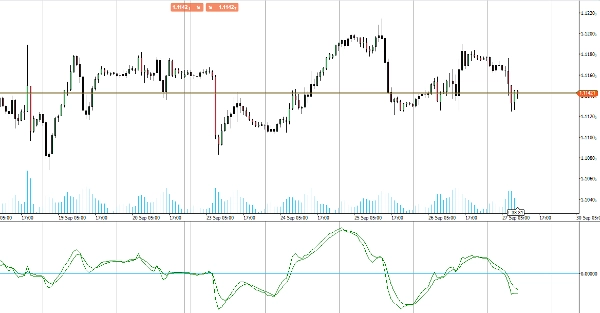
L’indicateur TSI mesure la force sous-jacente des mouvements de prix, en lissant le bruit du marché pour vous donner une image plus précise de la direction de la tendance. En mettant en évidence les conditions de surachat et de survente, le TSI vous aide à identifier les points de retournement potentiels et à confirmer les continuations de tendance.
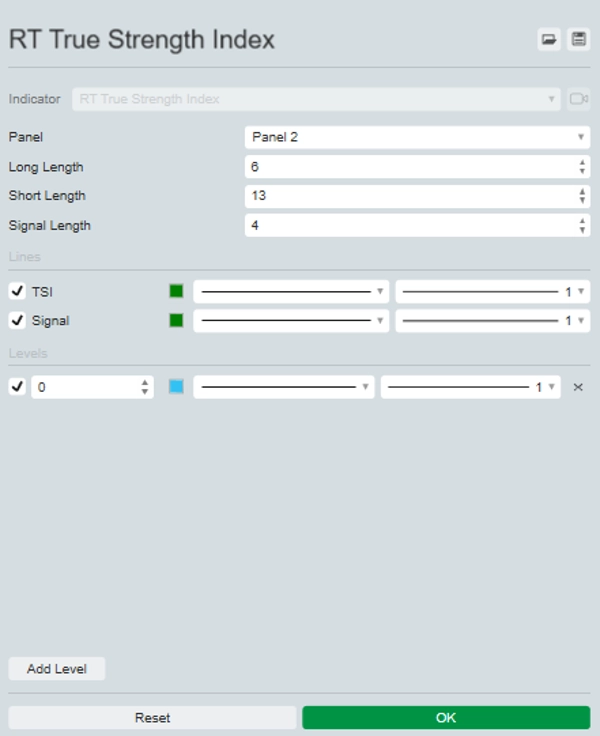
Le TSI utilise des moyennes mobiles du momentum sous-jacent d’un instrument financier. Le momentum est considéré comme un indicateur avancé des mouvements de prix, et une moyenne mobile suit généralement le prix avec un certain retard. Le TSI combine ces caractéristiques pour créer une indication du prix et de la direction plus synchronisée avec les retournements du marché que le momentum ou la moyenne mobile seuls.
Parfait pour les traders cherchant à affiner leur analyse et améliorer la prise de décision, l’indicateur TSI offre une manière fiable et intuitive d’évaluer la dynamique du marché. Améliorez votre boîte à outils de trading avec le True Strength Index pour une performance de trading supérieure.


![Logo de "[Hamster-Coder] Bollinger Bands"](https://cdn.ctrader.com/image/webp/21d8e5d6-fb11-4bac-b9ee-cd05c2b76804_30327)


