

Vwap Bands
อินดิเคเตอร์
1 การซื้อ
เวอร์ชัน 1.0, Apr 2026
Windows, Mac
5.0
รีวิว: 1
Trading product for Vwap Bands อินดิเคเตอร์ Moving Average VWAP, image 2
Trading product for Vwap Bands อินดิเคเตอร์ Moving Average VWAP, image 3
Trading product for Vwap Bands อินดิเคเตอร์ Moving Average VWAP, image 4
Trading product for Vwap Bands อินดิเคเตอร์ Moving Average VWAP, image 5
ตั้งแต่ 14/02/2025
10
การขาย

คำอธิบาย

ชุด VWAP สถาบันพร้อมแถบส่วนเบี่ยงเบนมาตรฐาน

ซื้อขายในที่ที่สถาบันซื้อขาย ชุด VWAP สถาบันให้เกณฑ์มาตรฐาน "มูลค่ายุติธรรม" ที่แม่นยำที่สุดสำหรับเซสชันภายในวันใด ๆ ซึ่งใช้โดยกองทุนเฮดจ์และโต๊ะอัลกอริทึมทั่วโลก


เกณฑ์มาตรฐานของการซื้อขายสถาบัน

VWAP ไม่ใช่แค่ตัวบ่งชี้อีกตัวหนึ่ง; มันคือราคากลางที่หลักทรัพย์ได้ซื้อขายตลอดทั้งวัน โดยอิงจากปริมาณและราคา เป็นเครื่องมือหลักที่ผู้ซื้อขายขนาดใหญ่ใช้เพื่อกำหนดประสิทธิภาพการเข้าซื้อ ชุดนี้เพิ่มประสิทธิภาพ VWAP มาตรฐานโดยเพิ่ม แถบความผันผวน (ส่วนเบี่ยงเบนมาตรฐาน) ช่วยให้คุณระบุสภาวะซื้อเกินและขายเกินได้อย่างแม่นยำทางคณิตศาสตร์


คุณสมบัติหลัก

    • การยึดจุดอ้างอิงภายในวันแบบไดนามิก: เลือกรีเซ็ตการคำนวณเมื่อเริ่มต้นวันหรือที่ เวลาช่วงเซสชันที่กำหนดเอง (เช่น การเปิดตลาดลอนดอนหรือ นิวยอร์ก) เพื่อให้สอดคล้องกับสภาพคล่องของตลาดเฉพาะ
    • แถบความผันผวนหลายระดับ:
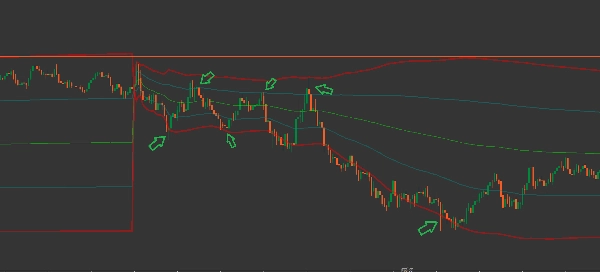
      • แถบ 1 (1 ส่วนเบี่ยงเบนมาตรฐาน): ครอบคลุมประมาณ 68% ของการเคลื่อนไหวของราคา—เหมาะสำหรับการติดตามแนวโน้มและการดึงกลับ
      • แถบ 2 (2 ส่วนเบี่ยงเบนมาตรฐาน): ครอบคลุม 95% ของการเคลื่อนไหวของราคา—เหมาะสำหรับการระบุจุดอ่อนล้าหลักของตลาดและจุดกลับตัว
    • ตรรกะสถาบันแท้จริง: แตกต่างจากค่าเฉลี่ยเคลื่อนที่มาตรฐาน ชุดนี้ใช้ ปริมาณติกสะสม เพื่อให้แน่ใจว่ากิจกรรมการซื้อขายหนักมีน้ำหนักมากกว่าเสียงรบกวนปริมาณต่ำ
    • ลำดับชั้นภาพที่ชัดเจน: มีเส้น VWAP สีทอง "พื้นฐาน" พร้อมแถบส่วนเบี่ยงเบนที่มีสีรหัสเพื่อให้อ่านกราฟได้ทันที
    • ความเข้ากันได้สากล: จำเป็นสำหรับการซื้อขายดัชนี (DAX, NASDAQ), ฟอเร็กซ์ และสินค้าโภคภัณฑ์ที่ราคาถ่วงน้ำหนักด้วยปริมาณเป็นหลัก


กลยุทธ์การซื้อขาย

    • การดึงกลับ: ในตลาดที่มีแนวโน้ม ให้มองหาราคาที่กลับมาที่ เส้น VWAP สีทอง เพื่อโอกาสเข้าซื้อที่มีความน่าจะเป็นสูงในทิศทางของแนวโน้ม
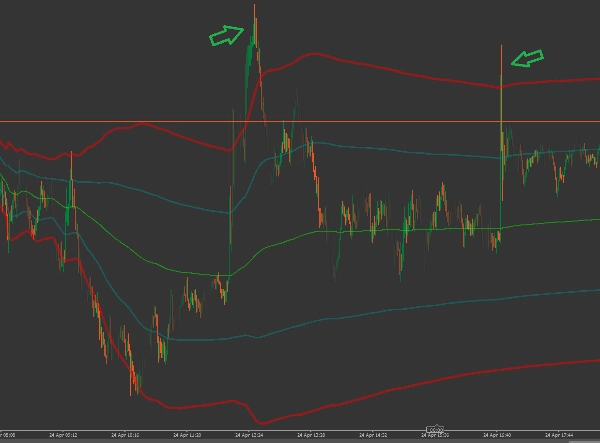
    • การกลับสู่ค่าเฉลี่ย: เมื่อราคาสัมผัสหรือเกิน แถบจุดสีแดง (แถบ 2 บน/ล่าง) ทางสถิติถือว่าราคายืดเกินไป มองหาการกลับตัวกลับสู่ VWAP
    • เริ่มเซสชัน: ตั้ง เวลาเริ่มต้น เป็น "08:00" หรือ "09:00" เพื่อจับโปรไฟล์ปริมาณเฉพาะของการเปิดตลาดยุโรปหรือสหรัฐฯ


พารามิเตอร์

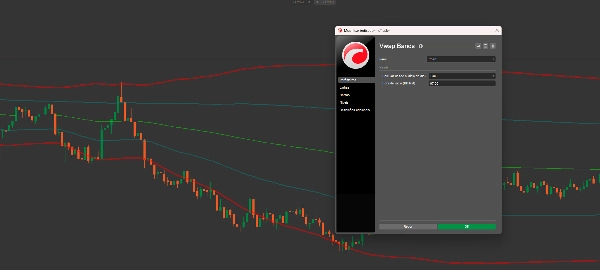
    • คำนวณจากจุดเริ่มต้นของวัน: สลับระหว่างการรีเซ็ตมาตรฐานเวลา 00:00 หรือการรีเซ็ตเวลาด้วยตนเอง
    • เวลาเริ่มต้น (ชั่วโมง:นาที): กำหนดเวลาที่แน่นอนที่ "วันซื้อขาย" ของคุณเริ่มต้น (เช่น 08:00 สำหรับการเปิดตลาดลอนดอน)
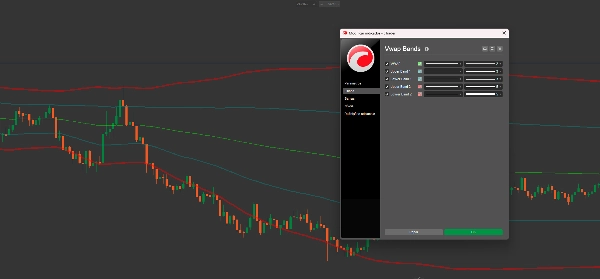
    • สไตล์ภาพ: ปรับความหนาและสไตล์เส้นสำหรับ VWAP และแถบส่วนเบี่ยงเบนทั้ง 4 ได้อย่างเต็มที่


ทำไมคุณถึงต้องการชุดนี้

ถ้าคุณซื้อขายโดยไม่มี VWAP คุณกำลังพลาด "พื้นที่มูลค่า" ตัวบ่งชี้นี้บอกคุณว่าคุณกำลังซื้อในราคาพรีเมียมหรือส่วนลดเมื่อเทียบกับตลาดโดยรวม มันเป็นเครื่องมือที่สำคัญที่สุดสำหรับผู้ซื้อขายภายในวันที่ต้องการทำให้การตั้งค่าของตนเป็นมืออาชีพ

ปรับกลยุทธ์ของคุณให้สอดคล้องกับ "ปลาตัวใหญ่" เพิ่มชุด VWAP สถาบันลงในกราฟ cTrader ของคุณวันนี้

สรุป

สรุปโดย AI
Vwap Bands is an institutional-grade intraday trading indicator that combines the Volume Weighted Average Price (VWAP) with multi-tiered standard deviation bands to provide a precise "fair value" benchmark. VWAP calculates the average price of a security weighted by volume throughout the trading day, serving as a key reference for large-scale traders to assess entry efficiency.
This suite enhances standard VWAP by adding two volatility bands: Band 1 (1 standard deviation) captures about 68% of price action, useful for trend-following and pullbacks; Band 2 (2 standard deviations) covers 95% of price action, highlighting potential market exhaustion and reversal points. The calculation uses cumulative tick volume, emphasizing heavy trading activity over low-volume noise.
Key features include dynamic intraday anchoring with customizable session start times (e.g., London or New York open), a clear visual hierarchy with a gold VWAP line and color-coded deviation bands, and universal compatibility across indices (DAX, NASDAQ), Forex, and commodities markets.
Traders can apply strategies such as entering on pullbacks to the VWAP line, identifying mean reversion when price touches outer bands, and aligning session start times to capture specific market volume profiles. Visual styles and calculation parameters are fully adjustable to fit individual trading preferences.
โปรไฟล์อินดิเคเตอร์
หมวดหมู่อินดิเคเตอร์
แนวรับและแนวต้าน
ประเภทเอาต์พุต
การแสดงเป็นภาพ
ตัวกรอง
ข้อกำหนดด้านข้อมูล
แท่งเท่านั้น
สัญญาณที่รองรับ
Cross
Reversal
ความแข็งแกร่งของแนวโน้ม
ความผันผวน
แตะ Level ที่ระบุ
เบรก Level ที่ระบุ
Range ณ เวลาที่เปิดเซสชัน
Breakout

รีวิวจากลูกค้า

5.0
รีวิว: 1
5
100 %
4
0 %
3
0 %
2
0 %
1
0 %
รีวิวจากลูกค้า
April 28, 2026
Works better when the trader stays patient.

การสนทนา

คำถามที่พบบ่อย

Moving Average
VWAP
ผลิตภัณฑ์ที่มีให้บริการผ่าน cTrader Store รวมถึงบอทการเทรด อินดิเคเตอร์ และปลั๊กอิน มีให้บริการโดยนักพัฒนาบุคคลที่สามและมีไว้เพื่อวัตถุประสงค์ในการเข้าถึงข้อมูลและทางเทคนิคเท่านั้น cTrader Store ไม่ใช่โบรกเกอร์และไม่ได้ให้คำแนะนำการลงทุน คำแนะนำส่วนบุคคล หรือการรับประกันผลการดำเนินงานในอนาคต

เพิ่มเติมจากผู้เขียนคนนี้

"Renko Bands Pro" โลโก้
ยอดนิยม
4.6
(3)
$29
/
$49
อินดิเคเตอร์
ATR
Key Levels
It combines the trend-filtering power of Renko charts with the volatility tracking of ATR Bands
"Delta-RSI Candle Pro" โลโก้
ยอดนิยม
5.0
(1)
$19
/
$29
อินดิเคเตอร์
ATR
RSI
+5
Delta RSI Candle Pro, the indicator that transforms ordinary candlesticks into powerful momentum visualizers.
อินดิเคเตอร์
Volume
Order Block
+1
Elevate your market analysis with the Aggression Delta Volume Profile, a premium, institutional-grade order flow utility
อินดิเคเตอร์
ATR
Volume
+4
This allows traders to see not just the trend, but whether the momentum itself is overextended.
อินดิเคเตอร์
ATR
SMC
+5
Candles Volume Delta is a powerful, visually intuitive indicator that transforms raw tick volume into actionable trading
อินดิเคเตอร์
ATR
Channel
+5
This fifth indicator is highly visual and focused on Supply and Demand zones
อินดิเคเตอร์
ATR
VWAP
+2
Volume-Weighted Trend System that combines VWMA with ATR for volatility filtering.
อินดิเคเตอร์
Channel
Moving Average
+2
This is a high-quality implementation of the Squeeze Momentum Candle logic applied directly to candle coloring.

นอกจากนี้คุณยังอาจชอบ

อินดิเคเตอร์
Block Liquidity,indicator.Block Order, Liquids Stops, Signal Sentiment,signal correctio.
อินดิเคเตอร์
MSS
Key Levels
+2
Maps equal highs, equal lows and active liquidity pools directly on your cTrader chart.
อินดิเคเตอร์
VWAP
NAS100
+5
Key NY session opens for NASDAQ (US100) & SP500 to find Tick Precise Entrys for High R:R intraday setups.
อินดิเคเตอร์
SMC
Forex
+5
Pinpoint FVGs, track fills and see mitigation stats — trade imbalances with clarity and confidence.
"Supply&Demand" โลโก้
ยอดนิยม
4.7
(4)
$19
/
$20
อินดิเคเตอร์
RSI
MACD
+1
Precision Supply & Demand zones indicator—automatically plots key buy/sell areas on your chart for smarter entries.
อินดิเคเตอร์
Allow trader to draw multi trendlines in different timeframes on one chart,Give trader an overview of the current market
อินดิเคเตอร์
SMC
Forex
+7
Simple Smart Money Concepts (SMC)
อินดิเคเตอร์
BOS
MSS
+3
Maps BOS, CHoCH, swing breaks and market structure shifts directly on your cTrader chart.
"ZigzagSR" โลโก้
ยอดนิยม
4.3
(3)
$19
/
$30
อินดิเคเตอร์
RSI
XAUUSD
+2
Automatic ZigZag swings with dynamic support & resistance levels, labeling highs/lows for clear trend signals.
อินดิเคเตอร์
RSI
MACD
Unlock market insights with our Multi-Timeframe Market Levels indicator, enhancing your trading strategies effortlessly
อินดิเคเตอร์
Key Levels
Liquidity Grab
+3
Visual market context dashboard showing bias states, CE positioning, session status and sweep context.
อินดิเคเตอร์
MSS
Key Levels
+4
Maps session ranges, previous highs/lows, equilibrium and premium/discount zones on your cTrader chart.
อินดิเคเตอร์
Prop
Forex
+12
A clean, real-time risk HUD designed to prevent prop firm account failure and protect your challenge account.
อินดิเคเตอร์
Drawdown Monitor
Proprietary trading desk risk monitoring dashboard!
"LevelMaster SR" โลโก้
ยอดนิยม
4.5
(2)
$19
/
$30
อินดิเคเตอร์
ATR
Forex
+3
LevelMaster S/R: Pinpoint key support & resistance zones with precision. Perfect for traders of all levels Trade smarter
อินดิเคเตอร์
Auto Fibonacci Retracement Indicator for cTrader
อินดิเคเตอร์
AI
SMC
+5
Coloring trendline/ Colored Trendline / Color Trendline
อินดิเคเตอร์
MACD
Prop
+8
NTNPICLL is a tool to check the best trading hours for the assets and also includes the highest and lowest point

ราคา

ตั้งแต่ 14/02/2025
10
การขาย
























