
Descripción
Candles Volume Delta es un indicador potente e intuitivo visualmente que transforma el volumen de ticks en información útil para el trading. Al colorear las barras de precio según la presión del volumen de compra/venta, proporciona una señal visual inmediata del sentimiento y la fuerza del mercado, ayudándote a detectar posibles continuaciones o reversiones de tendencia con solo un vistazo.
Características clave
-
- 🟢 Análisis visual del volumen: Colorea cada barra de precio según la dominancia del volumen de compra/venta
- 📊 Cálculo inteligente del delta: Calcula el delta de volumen durante un período definido por el usuario
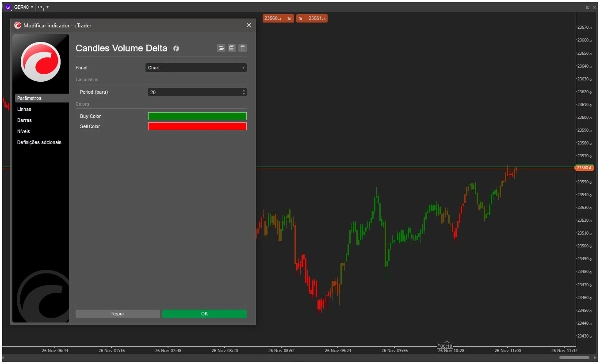
- 🎨 Colores personalizables: Esquemas de colores de compra/venta totalmente ajustables
- ⚡ Procesamiento en tiempo real: Optimizado para retroalimentación visual instantánea en nuevas barras
- 🛠️ Configuración sencilla: Configuración simple con valores predeterminados sensatos
Cómo funciona
Candles Volume Delta analiza el volumen de ticks durante el período que especifiques (por defecto: 20 barras) y calcula el porcentaje de volumen de compra frente al volumen de venta:
-
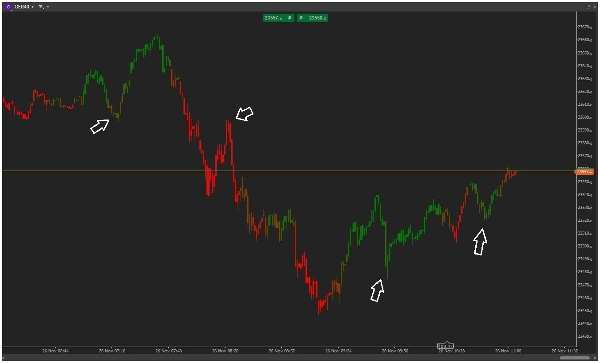
- Barras verdes: Alta presión de compra (típicamente >60% volumen de compra)
- Barras rojas: Alta presión de venta (típicamente <40% volumen de compra)
- Colores en degradado: Transiciones suaves de color que muestran niveles intermedios de fuerza
El indicador utiliza un suavizado basado en ATR para asegurar señales estables y significativas que se adaptan a la volatilidad actual del mercado.
Aplicaciones para el trading
-
- Confirmación de tendencia: Valida la fuerza de la tendencia con confirmación de volumen
- Señales de reversión: Detecta posibles reversiones cuando la acción del precio contradice el flujo de volumen
- Validación de rupturas: Confirma rupturas con evidencia de volumen de apoyo
- Sentimiento del mercado: Mide la dominancia general de compradores/vendedores en cualquier marco temporal
¿Por qué Candles Volume Delta?
A diferencia de los indicadores de volumen complejos que saturan tu gráfico, Candles Volume Delta proporciona retroalimentación visual inmediata mediante una codificación de colores simple. Es ligero, rápido y te ofrece la información esencial de volumen que necesitas sin datos abrumadores.
Perfecto para traders que quieren:
-
- Evaluación rápida del sentimiento del mercado
- Análisis limpio y sin saturación en el gráfico
- Confirmación visual de movimientos de precio
- Fácil integración en estrategias existentes
¡Instálalo hoy y observa los mercados a través de la dinámica del volumen!
Resumen
Key features include customizable color schemes, real-time processing for instant visual feedback, and easy setup with sensible defaults. The indicator helps traders quickly assess market sentiment, confirm trends, identify potential reversals, validate breakouts, and gauge buyer/seller dominance across timeframes. It is designed to provide essential volume insights without cluttering the chart, making it suitable for integration into various trading strategies, including scalping and trend analysis. Supported markets include indices and other instruments where volume analysis is relevant.
Valoraciones de clientes
5 | 100 % | |
4 | 0 % | |
3 | 0 % | |
2 | 0 % | |
1 | 0 % |


![Logotipo de "[Hamster-Coder] Pivot Points MTF"](https://cdn.ctrader.com/image/webp/4c143e5a-309c-40e3-a578-f04d1e133ffa_31159)


