
คำอธิบาย
ค่าเฉลี่ยเคลื่อนที่ Hull ที่มีสี – ทิศทางแนวโน้มในพริบตา
ภาพรวม
Hull Moving Average Colored เป็นตัวบ่งชี้แนวโน้มที่เรียบง่ายซึ่งใช้ความไวของ Hull Moving Average พร้อมสัญญาณทิศทางที่มีการระบุสี โดยแสดงแนวโน้มขาขึ้นเป็นสีเขียวและแนวโน้มขาลงเป็นสีแดง มันให้การยืนยันทิศทางโมเมนตัมอย่างรวดเร็วโดยไม่ต้องวิเคราะห์ที่ซับซ้อน
สิ่งที่มันทำ
พื้นฐานของ Hull Moving Average: ตัวบ่งชี้ใช้ Hull Moving Average (HMA) ซึ่งเป็นค่าเฉลี่ยเคลื่อนที่ที่ตอบสนองเร็วออกแบบมาเพื่อลดความล่าช้าในขณะที่ยังคงความนุ่มนวล แตกต่างจากค่าเฉลี่ยเคลื่อนที่แบบดั้งเดิม HMA ให้ความสำคัญกับราคาล่าสุด ทำให้มีประโยชน์อย่างยิ่งในการจับการเปลี่ยนแปลงแนวโน้มตั้งแต่เนิ่นๆ
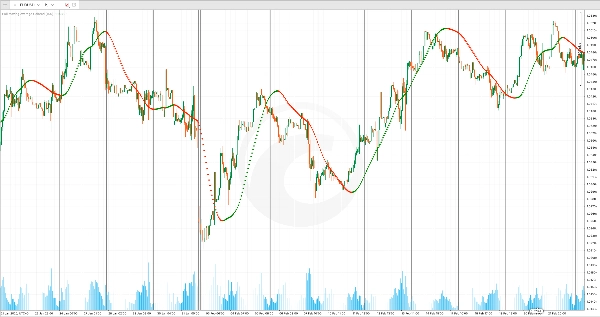
การแสดงแนวโน้มด้วยสีที่ระบุ: แทนที่จะเป็นเส้นเดียว ตัวบ่งชี้จะแสดงจุดทิศทาง:
- จุดสีเขียว: ปรากฏเมื่อ HMA กำลังขึ้น แสดงถึงโมเมนตัมขาขึ้น
- จุดสีแดง: ปรากฏเมื่อ HMA กำลังลง แสดงถึงโมเมนตัมขาลง
ระบบสีแบบไบนารีนี้ทำให้ทิศทางแนวโน้มชัดเจนในพริบตา—ไม่จำเป็นต้องตีความความชันหรือเปรียบเทียบกับแท่งก่อนหน้า
คุณสมบัติหลัก
การแสดงผลซ้อนทับ: ตัวบ่งชี้จะแสดงโดยตรงบนกราฟราคา ทำให้คุณเห็นทิศทางแนวโน้มสัมพันธ์กับระดับราคาจริง ซึ่งช่วยให้สังเกตได้ง่ายเมื่อราคาทะลุขึ้นหรือลงจากค่าเฉลี่ยเคลื่อนที่ สัญญาณจุดเข้าและออกที่เป็นไปได้
การลดความล่าช้าอย่างรวดเร็ว: Hull Moving Average ตอบสนองเร็วกว่าค่าเฉลี่ยเคลื่อนที่แบบเอ็กซ์โพเนนเชียลหรือแบบง่ายทั่วไป ทำให้มีประสิทธิภาพอย่างยิ่งสำหรับเทรดเดอร์สวิงและเทรดเดอร์รายวันที่ต้องการสัญญาณที่ทันเวลาโดยไม่มีการแกว่งตัวมากเกินไป
การปรับแต่งง่าย: ปรับ พารามิเตอร์ช่วงเวลา เพื่อควบคุมความไว ช่วงเวลาที่สั้นกว่า (เช่น 20-32) ทำให้ตัวบ่งชี้ตอบสนองต่อการเคลื่อนไหวล่าสุดได้ดีขึ้นแต่มีแนวโน้มสัญญาณผิดพลาดในตลาดที่ผันผวน ช่วงเวลาที่ยาวกว่า (เช่น 64-128) ให้แนวโน้มที่นุ่มนวลขึ้นพร้อมสัญญาณผิดพลาดน้อยลงแต่บางครั้งอาจพลาดการกลับตัวอย่างรวดเร็ว
การใช้งานจริง
ใช้ Hull Moving Average Colored เป็นตัวกรองอย่างรวดเร็วสำหรับทิศทางการเทรด เทรดเฉพาะเมื่อจุดสีเขียวปรากฏและราคาสูงกว่าค่าเฉลี่ยเท่านั้น; เทรดสั้นเฉพาะเมื่อจุดสีแดงปรากฏและราคาต่ำกว่าค่าเฉลี่ยเท่านั้น ในทางกลับกัน ให้ถือว่าการเปลี่ยนสีเป็นสัญญาณออกที่เป็นไปได้—เมื่อสีเขียวเปลี่ยนเป็นสีแดง ก็ถึงเวลาประเมินตำแหน่งยาวของคุณใหม่
ตัวบ่งชี้ทำงานได้ดีในตลาดที่มีแนวโน้มและมีประโยชน์อย่างยิ่งในกรอบเวลาที่สูงกว่า (4 ชั่วโมงและรายวัน) ซึ่งช่วยให้คุณสอดคล้องกับแนวโน้มทิศทางกว้างก่อนการเทรดในกรอบเวลาที่ต่ำกว่า
สรุป
This indicator overlays directly on price charts and uses a binary color system to indicate trend direction: green points appear when the HMA is rising, signaling upward momentum, and red points appear when the HMA is falling, signaling downward momentum. This visual approach allows traders to quickly identify trend direction without interpreting slopes or comparing previous bars.
Users can adjust the period parameter to control sensitivity—shorter periods increase responsiveness but may generate more false signals, while longer periods smooth trends but may delay signals. The indicator is suitable for various markets including Forex, indices, stocks, and cryptocurrencies such as BTCUSD and XAUUSD. It is particularly useful on higher timeframes (4-hour and daily) for aligning with broader market trends and can assist in identifying potential entry and exit points based on trend changes.
รีวิวจากลูกค้า
5 | 0 % | |
4 | 100 % | |
3 | 0 % | |
2 | 0 % | |
1 | 0 % |


