
Opis
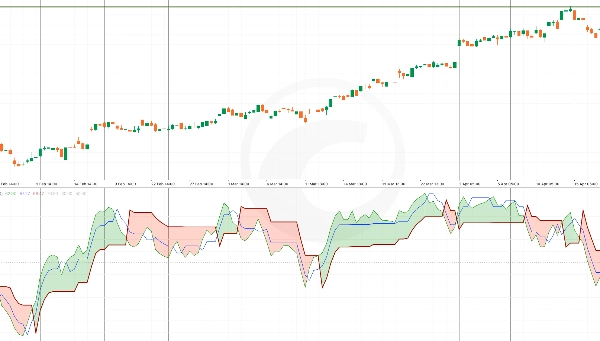
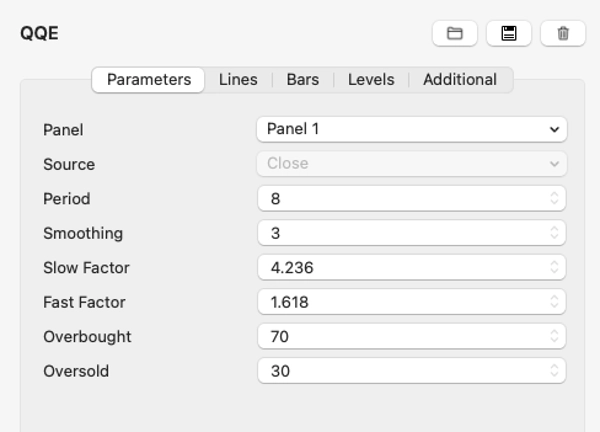
Wskaźnik Quantitative Qualitative Estimation (QQE) to narzędzie analizy technicznej, które ulepsza Relative Strength Index (RSI) poprzez włączenie wygładzonych średnich kroczących. Pomaga traderom ocenić siłę trendu, potencjalne odwrócenia oraz stany wykupienia/wyprzedania z większą dokładnością.
QQE zawiera dwa kluczowe elementy: szybkie i wolne poziomy trailing stop, które działają jako dynamiczne wsparcie i opór. Czyni to z niego wszechstronne narzędzie zarówno dla strategii podążania za trendem, jak i strategii powrotu do średniej. Przecięcie linii QQE z jej linią sygnałową często wskazuje na potencjalne okazje do kupna lub sprzedaży.
Podsumowanie
Podsumowanie AI
The Quantitative Qualitative Estimation (QQE) indicator is a technical analysis tool that enhances the Relative Strength Index (RSI) by integrating smoothed moving averages. It provides improved assessment of trend strength, potential reversals, and overbought or oversold market conditions. The indicator includes two main components: fast and slow trailing stop levels, which serve as dynamic support and resistance points. This design supports both trend-following and mean-reversion trading strategies. Additionally, crossovers between the QQE line and its signal line are used to identify potential buy or sell signals. The QQE indicator is applicable across various markets, including indices, and is categorized under momentum indicators.
Profil wskaźnika
Opinie klientów
0.0
Opinie: 0
Opinie klientów
Ten produkt nie ma jeszcze opinii. Wypróbowałeś(-aś) go już? Bądź pierwszy(-a) i powiedz o tym innym!
Dyskusja
Częste pytania
Signal
Indices
RSI
Produkty dostępne za pośrednictwem cTrader Store, w tym boty handlowe, wskaźniki i wtyczki, dostarczane są przez deweloperów zewnętrznych i udostępniane wyłącznie w celach informacyjnych oraz w celu zapewnienia dostępu technicznego. cTrader Store nie jest brokerem i nie zapewnia doradztwa inwestycyjnego, nie udziela spersonalizowanych rekomendacji ani nie gwarantuje przyszłych wyników.


Cena
12
Sprzedaż
421
Bezpłatne instalacje