
คำอธิบาย
🔍 ตรวจสอบข้อมูลปริมาณในช่วงเวลาทางประวัติศาสตร์ที่เฉพาะเจาะจง โดยเน้นพื้นที่ที่นักลงทุนที่ใช้เลเวอเรจสูงอาจเผชิญกับการถูกบังคับปิดสถานะ ให้ข้อมูลเชิงลึกที่มีคุณค่าเกี่ยวกับพฤติกรรมตลาด
ตัวชี้วัดนี้ทำอะไร?
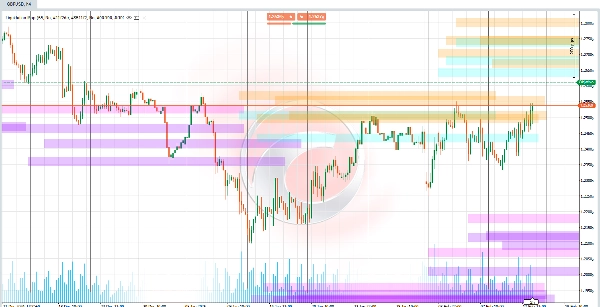
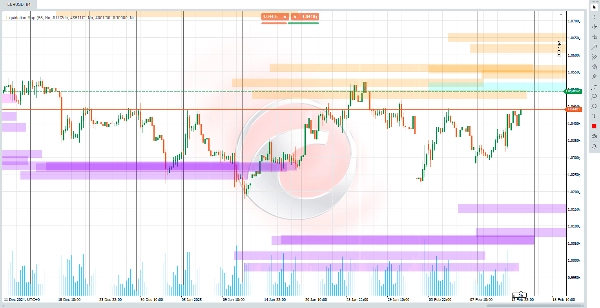
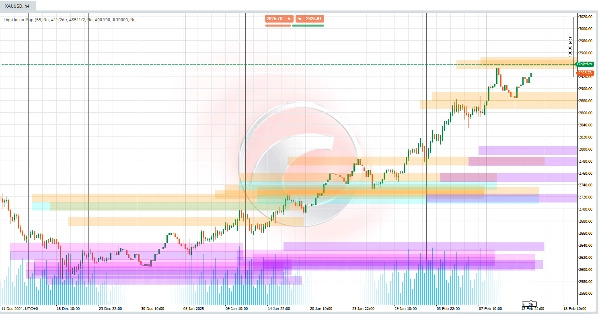
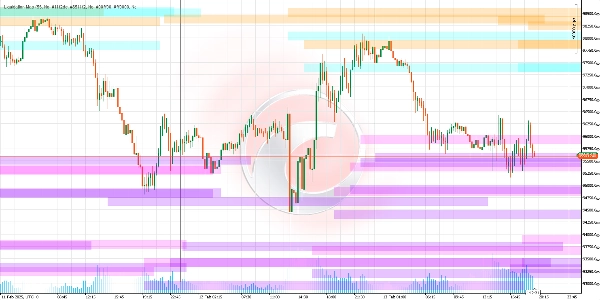
อัลกอริทึมนี้ระบุระดับราคาที่ การบังคับปิดสถานะจำนวนมาก ของตำแหน่งที่ใช้เลเวอเรจ (เช่น 5x, 10x, 25x, 50x หรือ 100x) มีแนวโน้มที่จะเกิดขึ้น ระดับเหล่านี้ทำหน้าที่เป็น "แม่เหล็ก" สำหรับการเคลื่อนไหวของราคา เนื่องจากการบังคับปิดสถานะสามารถกระตุ้นให้เกิดความผันผวนอย่างรุนแรงในตลาด ตัวชี้วัดจะวาดเส้นแนวนอนบนแผนภูมิ แสดงถึงเกณฑ์เหล่านี้และทำนายไปข้างหน้าเพื่อคาดการณ์โซนที่น่าสนใจ
ระดับเหล่านี้คำนวณอย่างไร?
- การตรวจจับจุดเปลี่ยนราคาหลัก:
🔄 ระบุจุดสูงสุดและต่ำสุดล่าสุดบนแผนภูมิ (จุดที่ราคามีการเปลี่ยนทิศทาง) จุดเปลี่ยนเหล่านี้เป็นพื้นฐานสำหรับการคำนวณระดับการบังคับปิดสถานะ - ปริมาณเป็นตัวกระตุ้น:
📊 เปรียบเทียบปริมาณปัจจุบันกับค่าเฉลี่ยในอดีต หากปริมาณเกินเกณฑ์ที่กำหนด (เช่น 1.2 เท่าของค่าเฉลี่ยสำหรับ 100x) จะเปิดใช้งานระดับการบังคับปิดสถานะที่เกี่ยวข้อง - สูตรการบังคับปิดสถานะ:
ยิ่งเลเวอเรจสูง ระดับการบังคับปิดสถานะจะยิ่งใกล้ราคาปัจจุบันมากขึ้น -
- สำหรับ ตำแหน่งซื้อ: ระดับการบังคับปิดสถานะถูกตั้งไว้ ต่ำกว่า จุดต่ำสุดหลัก โดยคำนวณตามเลเวอเรจ (เช่น ต่ำกว่า 2% สำหรับ 50x)
- สำหรับ ตำแหน่งขาย: ระดับถูกตั้งไว้ สูงกว่า จุดสูงสุดหลัก โดยใช้หลักการเดียวกัน
คุณคาดหวังอะไรเมื่อใช้มัน?
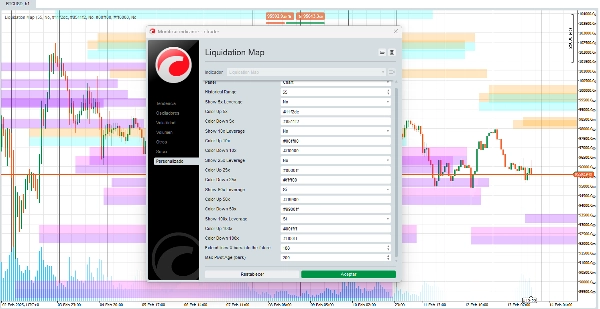
- เส้นสภาพคล่อง: 🎨 คุณจะเห็นเส้นแนวนอนที่ปรับแต่งได้ แสดงโซนที่ตลาดอาจมีความผันผวนสูงเนื่องจากการบังคับปิดสถานะ
- เลเวอเรจที่ปรับแต่งได้: ⚙️ คุณสามารถเปิด/ปิดระดับสำหรับแต่ละประเภทเลเวอเรจ (เช่น เน้นเฉพาะ 50x และ 100x)
- การปรับแต่งสี: 🌈 คุณสามารถเลือกสีสำหรับแต่ละช่วงการบังคับปิดสถานะ ปรับแต่งการแสดงผลตามความชอบของคุณ
- โซนความแออัด: 🎯 เส้นหลายเส้นที่อยู่ใกล้กันบ่งชี้พื้นที่ความเสี่ยงสูง/ผลตอบแทนสูงที่อาจเกิดการบังคับปิดสถานะหลายรายการพร้อมกัน
ตีความสัญญาณอย่างไร?
- ราคากำลังเข้าใกล้เส้น: 🚨 หากราคากำลังเข้าใกล้ระดับการบังคับปิดสถานะ (โดยเฉพาะอย่างยิ่งเมื่อมีปริมาณสูง) โอกาสที่จะเกิดการเคลื่อนไหวอย่างรุนแรงจะเพิ่มขึ้น
- สีและความโปร่งใส: 🎨 สีแตกต่างกันตามเลเวอเรจ (เช่น สีน้ำเงินสำหรับ 25x, สีส้มสำหรับ 50x) ความโปร่งใสแสดงถึง "ความแข็งแกร่ง" ของปริมาณที่เกี่ยวข้อง (เส้นที่เข้ม = ปริมาณสำคัญมากขึ้น)
ทำไมมันถึงมีประโยชน์?
- การพยากรณ์เชิงรุก: 🔮 มันไม่ได้วิเคราะห์แค่ในอดีต แต่ยังทำนายระดับในอนาคตตามสภาพปัจจุบัน
- เน้นจิตวิทยาตลาด: 🧠 การบังคับปิดสถานะมักสร้างปฏิกิริยาลูกโซ่ (เช่น คำสั่งหยุดขาดทุนกระตุ้นการขายเพิ่มเติม) ตัวชี้วัดนี้ช่วยให้คุณคาดการณ์ได้
- การปรับแต่ง: 🛠️ ปรับแต่งการแสดงผลให้เหมาะกับกลยุทธ์ของคุณ (เช่น ให้ความสำคัญกับเลเวอเรจสูงในตลาดที่ผันผวน)
ข้อจำกัดที่ควรพิจารณา
- การพึ่งพาปริมาณ: 📉 หากปริมาณต่ำหรือข้อมูลในอดีตไม่เพียงพอ สัญญาณอาจไม่น่าเชื่อถือ
- ไม่ใช่ลูกแก้วทำนาย: 🔮 ระดับแสดงโซนที่น่าจะเป็นไปได้ ไม่ใช่ความแน่นอน ควรรวมกับการวิเคราะห์อื่นๆ เสมอ
- สภาพแวดล้อมที่เปลี่ยนแปลงตลอดเวลา: 🌍 ในตลาดที่มีข่าวไม่คาดคิด การบังคับปิดสถานะอาจเกิดขึ้นนอกเหนือระดับที่ทำนายไว้
ตัวชี้วัดจาก Ctrader Store:
Dynamic Market Structure
Analysis of Turning Points
Fibonacci Linear
Regression Multi-timeframe
Multi-Level Candle Bias
Tracker
Auto Support and
Resistance Trend Lines
สรุป
The indicator calculates these levels by detecting recent price pivots (highs and lows), comparing current volume against historical averages to activate relevant leverage thresholds, and applying a formula where higher leverage corresponds to liquidation levels closer to the current price. For long positions, liquidation levels are set below pivot lows; for short positions, above pivot highs.
Users can customize the indicator by enabling or disabling specific leverage levels and adjusting the colors of the liquidation lines. Clusters of lines indicate congestion zones with heightened risk and potential for sharp price swings. The transparency of lines reflects the strength of associated volume.
This tool aids in proactive forecasting of market moves driven by forced liquidations, helping traders anticipate volatility and market psychology effects. It is volume-dependent and should be used alongside other analyses, as it indicates probable zones rather than certainties.
รีวิวจากลูกค้า
5 | 67 % | |
4 | 0 % | |
3 | 33 % | |
2 | 0 % | |
1 | 0 % |


