설명
🏆 10,000명 이상의 트레이더가 우리의 25개 이상의 알고리즘 스위트를 신뢰합니다! 🏆
부터 시장 구조 및 유동성 까지 스마트 종료 시스템 및 예측 도구 - 우리는 일관성을 위한 모든 도구를 구축했습니다.
👉 모든 25개 이상의 검증된 시스템에 액세스하세요:
_______________________________________________
📌 시장 구조 지표
· ✅ AdvancedMarket Structure: Bos, Choch, SwinLevels, Order Blocks, 시장 구조및 유동성 파인더
· 🔄 전환점의 동적 시장 구조 분석
· 🧱 오더 블록
· ⚖️ 시장 불균형
· ⛓️ BOS 및 CHOCH
· 🧠 ICT 파워 오브 3
· 🌀 시장 극성 구역
_______________________________________________
🔚 스마트 종료 시스템
· 📍 트레일링 스마트 알고리즘
_______________________________________________
📐 지그재그 지표
· 🔍 지그재그 가격 유동성 투영
· 🧭 S&R 구조적 지그재그
· ➖ 지그재그
· 🎯 지그재그 극단 추적기
_______________________________________________
🧱 지지 및 저항 지표
· 🟩 스마트 트렌드 지지 및 저항선
· 🧱 모든 지지 및 저항 레벨
_______________________________________________
📊 트렌드 및 채널 지표
· 🔄 자동 트렌드 채널
· 📊 슈퍼트렌드
· ⚡모멘텀 트렌드 분석기
· 🧠 적응형 트렌드 채널
· 💥 채널 돌파 시스템
· 🌈 동적 트렌드 그라디언트
· ⭐ 프리미엄 SSL 채널
· 🔁 반응형 이동 평균
_______________________________________________
💧 거래량 및 유동성 도구
· 🔥 거래량 POC 히트맵
· 📉 레버리지 청산 지도
· 🔍 모멘텀 공정 가치 갭
· 🕒 공정 가치 갭 세션
_______________________________________________
⚡ 모멘텀 및 RSI 지표
· 📈 RSI 트렌드 트리거
· 🚀 동적 범위 모멘텀
_______________________________________________
🔮 예측 및 투영 도구
· 📈 거래량 기반 시장 흐름 투영기_________________________
_________________________________________________________________________________________________
_________________________________________________________________________________________________
RSI 채널 트리거: 📶
이것이란: RSI(기간)를 계산하고 RSI가 과매수/과매도 임계값(기본값 70/30)을 교차할 때 모멘텀 구역을 시각적으로 표시하는 지표입니다. ✅
https://chartshots.spotware.com/c/69278f8b6d973
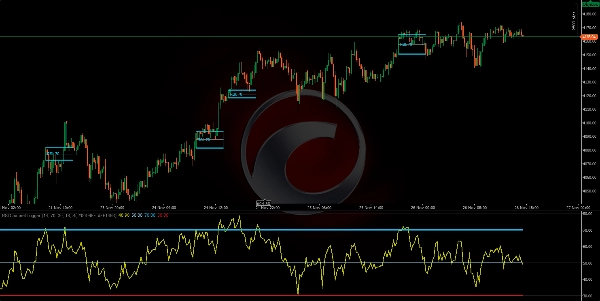
논리: 임계값이 교차되면 교차 순간 캔들의 고가/저가를 기반으로 "구역"을 생성합니다. 그런 다음: 🧠
- 그 구역 내의 캔들에 색을 칠합니다.
- 채널(고가, 저가, 중간)을 그립니다.
- RSI 패널에 원과 라벨로 교차를 표시합니다.
구역은 정확히 MinZoneDuration 바 동안 지속됩니다. ⏱️
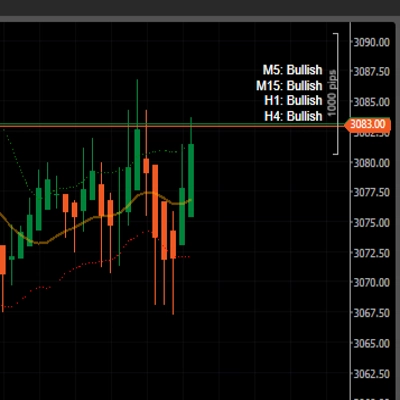
명확한 신호:
- 과매수 위로의 교차 → 강세 구역를 시작합니다. 🟢
- 과매도 아래로의 교차 → 약세 구역를 시작합니다. 🔴
구역 자체는 관심 영역이며 주문이 아닙니다.
https://chartshots.spotware.com/c/69278fb274e0b
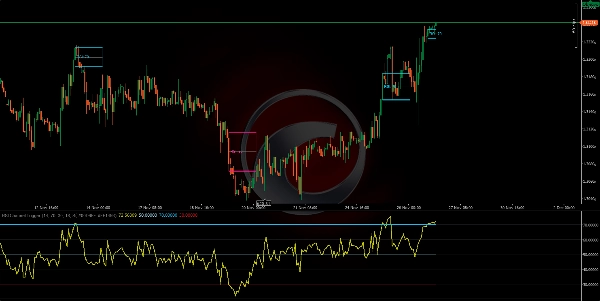
사용 방법 (간단):
- 구역이 형성될 때까지 기다립니다. 🎯
- 가격 움직임(채널 라인에서의 돌파/거부)으로 확인합니다.
- 구역 외부에 손절(stop loss)을 설정하고 중간 채널 라인 또는 정의된 위험/보상 비율에 목표(target)를 설정하여 진입합니다.
https://chartshots.spotware.com/c/69278fe76237b
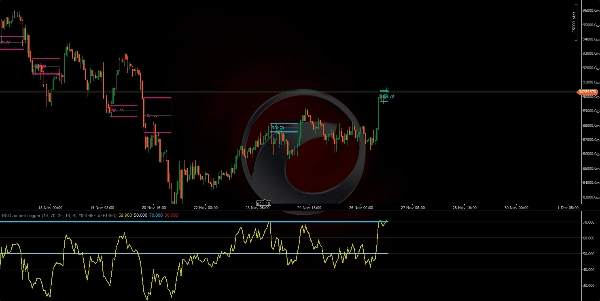
주요 매개변수: ⚙️
- RSI 기간 (14)
- 과매수 (70)
- 과매도 (30)
- 최소 구역 지속 시간 (15)
- 구성 가능한 색상 🎨
요약
Clear signals include:
- RSI crossing above the overbought level, initiating a bullish momentum zone.
- RSI crossing below the oversold level, initiating a bearish momentum zone.
These zones serve as areas of interest rather than direct trade orders. Users can confirm signals with price action such as breakouts or rejections from channel lines and plan entries with stop losses placed outside the zone and targets at the mid-channel line or based on risk/reward ratios.
The indicator supports multiple markets and symbols including Forex pairs (EURUSD, GBPUSD, NZDUSD, USDJPY), commodities (XAUUSD), indices (NAS100), cryptocurrencies (BTCUSD), and stocks. It offers configurable parameters for RSI period, threshold levels, zone duration, and colors.