Descrição
Indicadores da loja Pinescriptlabs: cBots da loja Pinescriptlabs : (cBot) Gold & BTC BreakoutSession Pivots(novo)
Projeção de Liquidez de Preço ZigZag
Algoritmo Inteligente de Trailing (novo)
Mapa de Liquidação de Alavancagem
Previsão Baseada em Linreg & ATR
Suporte & SmartTrend
Resistência
Linhas
Sistema de Rompimento de Canal
Análise
Dinâmica da Estrutura
de Mercado
de
Pontos
de Virada
Regressão
Linear
Fibonacci
Multi-temporal
Gap de Valor Justo de Momentum
Gradiente de Tendência Dinâmico
Rastreador
de Viés
de Vela
Multi-Nível
Rastreador de Extremos Zig-Zag
Tendência
de Suporte e
Resistência
Linhas
Todos
Níveis de
Suporte e
Resistência
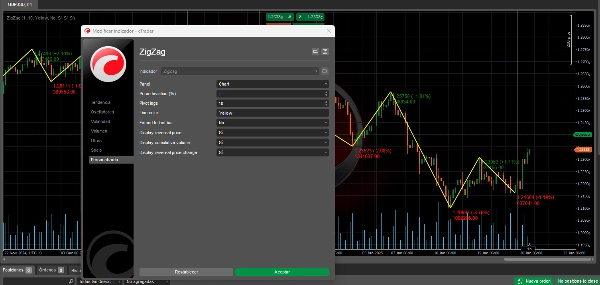
O Indicador ZigZag: Simplificando as Tendências do Mercado 📉📈
O ZigZag é um indicador técnico que ajuda a identificar mudanças significativas de tendência em um ativo, filtrando movimentos menores do mercado. Seu propósito principal é simplificar a análise visual do preço, eliminando o "ruído" das pequenas flutuações.
Como Funciona ⚙️
- 📊 Analisa preços para encontrar pontos de virada significativos (pivôs).
- 📈 Um ponto de virada é considerado significativo quando o preço muda por uma porcentagem mínima específica (parâmetro de desvio).
- 🔗 Conecta esses pontos de virada com linhas retas, formando um padrão "zigzag".
- 🕒 Atualiza-se dinamicamente conforme novos dados de preço surgem.
Utilidade para Trading 💡
Identificação de Tendência 📐
- 🔍 Ajuda a visualizar a direção principal do mercado.
- 🚀 Facilita a identificação de tendências de alta e baixa.
- 📏 Destaca claramente níveis-chave de suporte e resistência.
Análise de Padrões 📋
- 🎯 Simplifica a identificação de padrões gráficos.
- 🕵️♂️ Destaca formações de preço como triângulos, bandeiras e outros padrões.
- 🌊 Melhora a clareza ao reconhecer ondas de Elliott.
Gestão de Trades 🎛️
- 🎯 Identifica potenciais pontos de entrada e saída.
- 🛡️ Ajuda a determinar níveis de stop-loss baseados em pivôs anteriores.
- 🎯 Facilita a definição de metas de preço realistas.
Análise de Volatilidade 🌡️
- 📏 A distância entre pivôs reflete a volatilidade do mercado.
- 🧩 Ajuda a ajustar estratégias conforme o tamanho dos movimentos.
- ⏳ Distingue entre períodos de consolidação e tendências direcionais.
Confirmação de Sinal ✅
- 🔍 Serve como ferramenta de confirmação para outros indicadores.
- 🚪 Valida rompimentos de níveis-chave.
- 🔗 Pode ser combinado com outros indicadores para estratégias mais robustas.
Considerações Importantes 🧠
É Retrospectivo 📅
- ⏪ Pontos de pivô só são confirmados após o movimento ocorrer.
- 🔮 Não é preditivo por si só.
- ⚖️ Deve ser usado em combinação com outros indicadores para tomada de decisão.
Ajustes de Parâmetros 🔧
- 🎚️ A sensibilidade depende da porcentagem de desvio definida.
- 🔍 Uma porcentagem menor mostra mais pontos de pivô.
- 🧹 Uma porcentagem maior filtra movimentos menores, mostrando apenas mudanças significativas.
Uso de Timeframe 🕒
- 🕰️ Funciona em qualquer timeframe.
- 🔄 Parâmetros devem ser ajustados com base nos horizontes de negociação.
- 🌐 Analisar em múltiplos timeframes oferece uma visão mais abrangente.
📈 Use o indicador ZigZag como uma ferramenta poderosa para simplificar a análise, identificar tendências e melhorar a tomada de decisões em sua jornada de trading! 🚀
Resumo
Key functionalities include:
- Trend Identification: Visualizes primary market direction, highlights bullish and bearish trends, and marks key support and resistance levels.
- Pattern Analysis: Simplifies recognition of chart patterns such as triangles, flags, and Elliott waves.
- Trade Management: Assists in identifying entry and exit points, setting stop-loss levels based on previous pivots, and establishing realistic price targets.
- Volatility Analysis: Reflects market volatility through pivot distances, aiding strategy adjustments and distinguishing consolidation from trending phases.
- Signal Confirmation: Validates breakouts and complements other indicators for robust trading strategies.
The indicator is retrospective, confirming pivots only after price movements occur, and is not predictive on its own. Sensitivity can be adjusted via the deviation percentage to show more or fewer pivot points. It is compatible with any timeframe and benefits from multi-timeframe analysis for comprehensive market views.
This tool supports analysis across various markets including cryptocurrencies (BTCUSD), commodities (XAUUSD), and others, and integrates with related indicators like RSI, ATR, and Supertrend.
Avaliações de clientes
5 | 50 % | |
4 | 33 % | |
3 | 17 % | |
2 | 0 % | |
1 | 0 % |