
Side Volume Profile
Индикатор
11 покупки
Версия 1.0, Aug 2025
Windows, Mac
4.3
Отзывы: 3
С 26/05/2025
385.09M
Торгуемый объем
60.66K
Выигранные пипы
14
Продажи
1.4K
Бесплатные установки
Описание
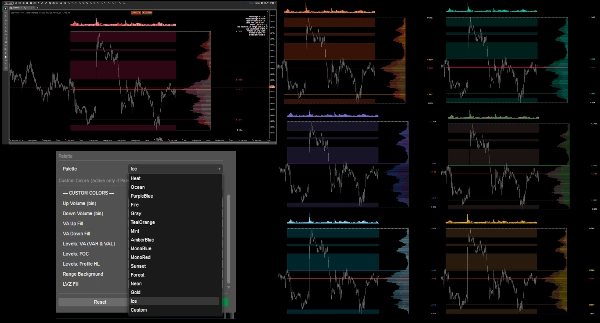
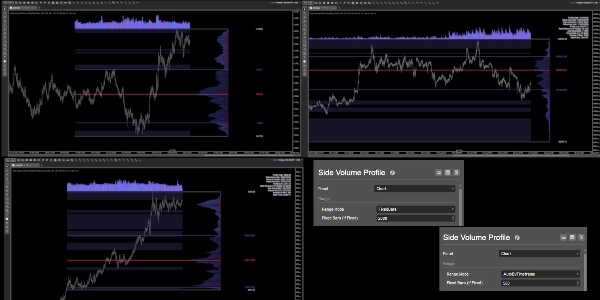
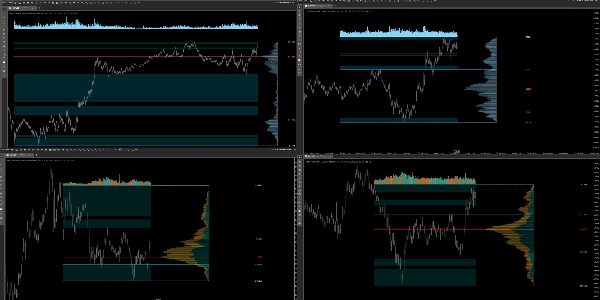
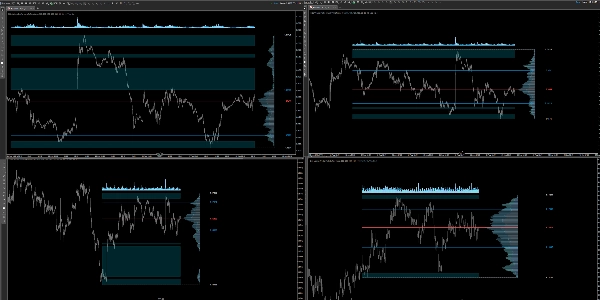
Профиль объема с правой стороны, который всегда закреплен за последними барами и не прыгает при прокрутке графика. Он вычисляет объем по цене за выбранный диапазон (авто по таймфрейму или фиксированное количество баров), показывает POC, VAH/VAL, границы профиля (High/Low), выделяет зоны с низким объемом (LVZ) и рисует гистограмму объема с EMA выше диапазона (смещение в пипсах). Включает панель статистики в правом верхнем углу, несколько палитр с высоким контрастом плюс пользовательские цвета, глобальную непрозрачность бинов, управление шириной/смещением и толщиной/стилем каждой линии. Создан для удобочитаемости и производительности.
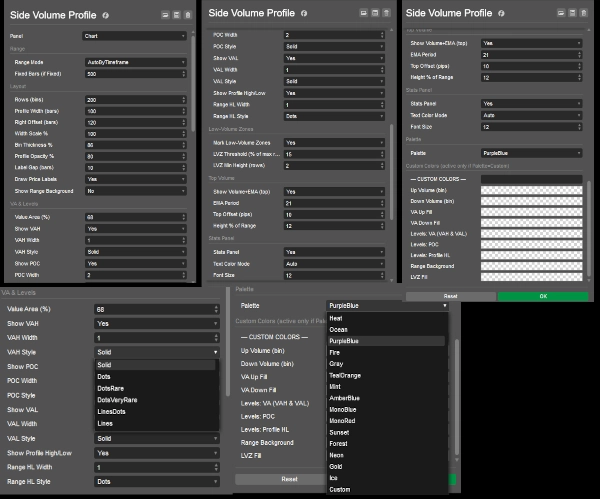
- Диапазон: AutoByTimeframe или FixedBars.
- Макет: Строки (бины), ширина профиля / масштаб ширины, правое смещение, толщина бина, промежуток меток, непрозрачность профиля; опциональный фон диапазона.
- VA и уровни: Процент зоны стоимости, переключение VAH/POC/VAL, ширина и стиль линии для каждого уровня; High/Low профиля.
- Зоны с низким объемом: Порог (% от максимальной строки) и минимальная высота (строки).
- Верхний объем: Период EMA, высота (% от диапазона), стандартное смещение 10 пипсов.
- Палитра/Пользовательская: Выберите тему или задайте свои цвета (VAH = VAL).
- Панель статистики: Переключение, размер шрифта
Документация индикатора
Сводка
ИИ-сводка
Side Volume Profile is a right-anchored volume profile indicator designed for cTrader that displays volume-by-price data over a selectable range, either automatically by timeframe or a fixed number of bars. It visualizes key volume levels including Point of Control (POC), Value Area High (VAH), Value Area Low (VAL), and profile bounds (high/low). The indicator highlights low-volume zones (LVZ) based on configurable thresholds and minimum heights. It also features a volume histogram with an exponential moving average (EMA) offset in pips above the profile range.
Users can customize the layout with controls for row bins, profile width and scale, right offset, bin thickness, label gaps, and opacity. Line widths and styles for VAH, POC, VAL, and profile bounds are adjustable. Multiple high-contrast color palettes and custom color options are available. A toggleable top-right statistics panel provides summary data with adjustable font size.
The indicator supports various markets including Forex, indices, commodities, cryptocurrencies, and stocks, with tags referencing symbols like BTCUSD, EURUSD, GBPUSD, XAUUSD, NAS100, and USDJPY. It is built for readability and performance, maintaining a stable position on the chart without shifting when panning.
Профиль индикатора
Отзывы покупателей
4.3
Отзывы: 3
5 | 33 % | |
4 | 67 % | |
3 | 0 % | |
2 | 0 % | |
1 | 0 % |
Отзывы покупателей
Обсуждение
Частые вопросы
BTCUSD
Forex
Indices
EURUSD
Commodities
GBPUSD
NZDUSD
Prop
Fair Value Gap
SMC
Crypto
Stocks
XAUUSD
NAS100
USDJPY
VWAP
Продукты, доступные в cTrader Store, включая торговых ботов, индикаторы и плагины, предоставляются сторонними разработчиками и доступны исключительно в информационных и технических целях. cTrader Store не является брокером и не предоставляет инвестиционные консультации, персональные рекомендации или какие-либо гарантии будущей доходности.
Больше от этого автора


Цена
С 26/05/2025
385.09M
Торгуемый объем
60.66K
Выигранные пипы
14
Продажи
1.4K
Бесплатные установки