
VolumeThermometer
Indicador
426 descargas
Versión 1.0, Aug 2025
Windows, Mac
Desde 26/05/2025
451.48M
Volumen operado
61.16K
Pips ganados
15
Ventas
1.43K
Instalaciones gratis
Descripción
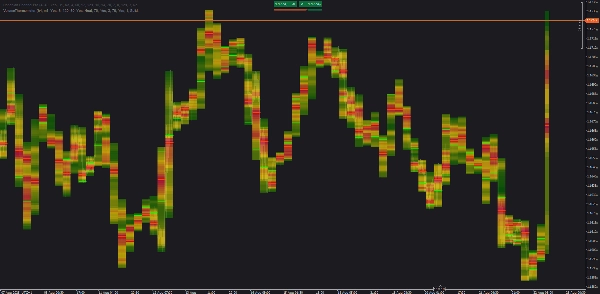
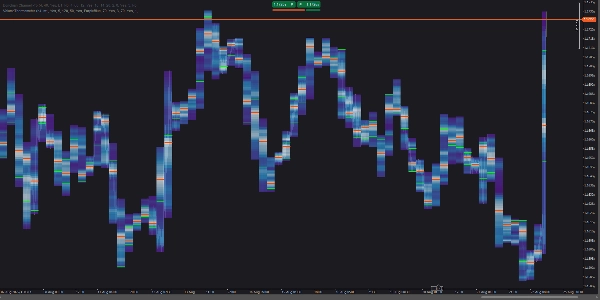
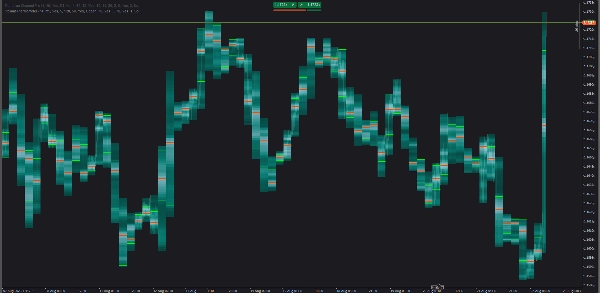
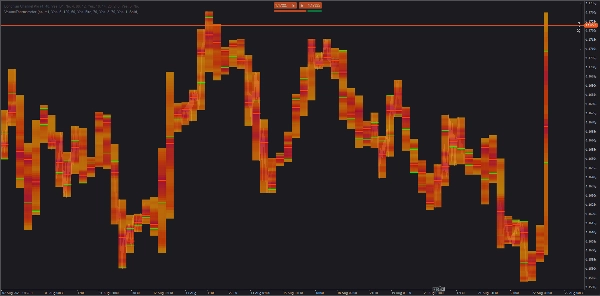
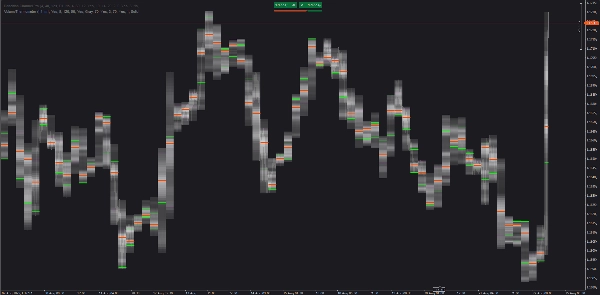
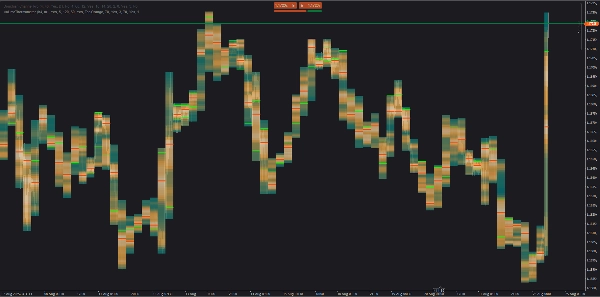
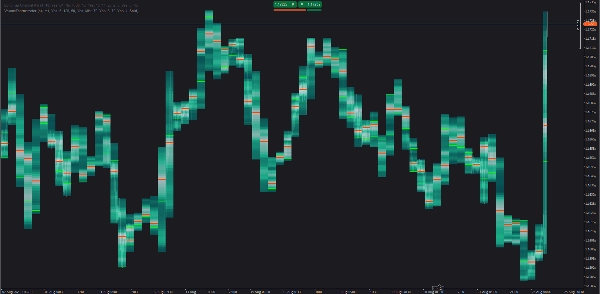
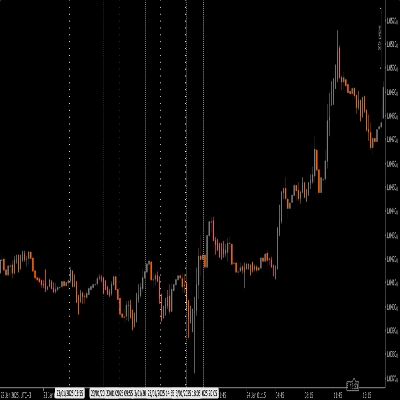
Un mapa de calor de cTrader que muestra cómo se distribuye el volumen dentro de cada vela HTF. Utiliza barras LTF (por ejemplo, M1) para construir contenedores verticales de volumen, luego dibuja POC y líneas de Área de Valor (VA). La vela HTF actual (incompleta) se pinta en tiempo real.
Cómo funciona
- Agrega volumen de ticks de barras LTF.
- Divide cada vela HTF en
Binsrebanadas de precio y asigna volumen según la superposición de precios. - Colorea los bins por volumen relativo; dibuja POC, líneas opcionales de VA, y puede extender estas hacia la derecha.
- Carga automáticamente el historial antiguo solo para el rango visible (pequeños lotes).
Úsalo
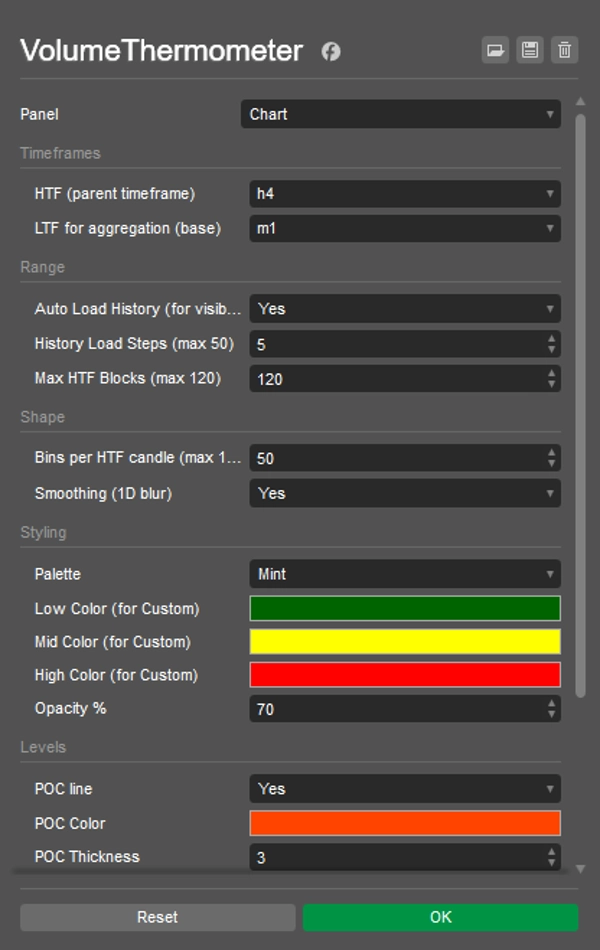
- Elige HTF (por ejemplo, H4) y LTF (por ejemplo, M1).
- Activa Carga Automática de Historial; desplázate/ajusta el zoom al rango que deseas.
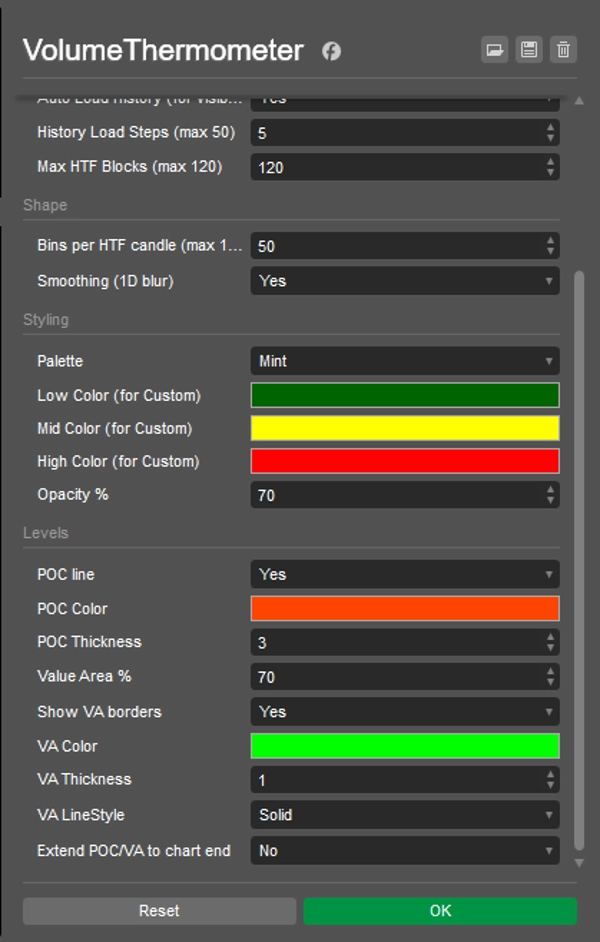
- Ajusta Bins (detalle), Máximo de Bloques HTF (cuántas velas mostrar), Suavizado, Opacidad y colores.
- Observa las reacciones de POC/VA y cómo el POC migra de vela en vela.
Ideas rápidas
- Retesteo de POC: primer toque del POC previo con confirmación LTF.
- Rotación de VA: la reentrada en VA a menudo apunta al borde POC/u otro borde de VA.
- Paso a través de LVN: las áreas delgadas (frías) tienden a moverse rápido hacia el siguiente nodo.
Notas
- Usa volumen de ticks (buen proxy en FX/CFD, no volumen de intercambio).
- Para mejorar el rendimiento, reduce Bins o Máximo de Bloques HTF si es necesario.
Resumen
Resumen de IA
VolumeThermometer is a cTrader indicator that visualizes intra-higher timeframe (HTF) volume distribution using a heatmap. It aggregates tick volume data from lower timeframe (LTF) bars (e.g., M1) to construct vertical volume bins within each HTF candle (e.g., H4). The indicator highlights the Point of Control (POC) and Value Area (VA) lines, showing where the most volume is concentrated by price level. The current HTF candle is updated in real time, and the indicator automatically loads historical data for the visible chart range in small batches to optimize performance.
Key features include:
- Aggregation of tick volume from LTF bars.
- Division of HTF candles into price bins with volume assigned by price overlap.
- Color-coded volume bins indicating relative volume intensity.
- Display of POC and optional VA lines, with the ability to extend these lines forward.
- Customizable settings for bin detail, maximum HTF candles displayed, smoothing, opacity, and colors.
- Supports multiple markets including Forex, indices, commodities, stocks, and cryptocurrencies such as BTCUSD and EURUSD.
Users can monitor POC retests, VA rotations, and low volume node pass-throughs to analyze volume behavior within HTF candles. The indicator uses tick volume as a proxy, suitable for FX and CFD markets.
Perfil del indicador
Valoraciones de clientes
0.0
Valoraciones: 0
Valoraciones de clientes
Este producto todavía no se ha valorado. ¿Ya lo ha probado? Sea el primero en informar a otros.
Conversación
Preguntas frecuentes
BTCUSD
Prop
Forex
Indices
EURUSD
Commodities
Crypto
Stocks
NAS100
Los productos disponibles a través de cTrader Store, incluidos bots, indicadores y plugins para operar, son proporcionados por desarrolladores de terceros y están disponibles únicamente con fines informativos y de acceso técnico. cTrader Store no es un bróker, por lo que no proporciona asesoramiento de inversión, recomendaciones personales ni ninguna garantía de rentabilidad futura.


![Logotipo de "[Hamster-Coder] Moving Average MTF"](https://cdn.ctrader.com/image/webp/b11b98b1-194d-4b8e-b00e-d611826ad159_31226)


Precio
Desde 26/05/2025
451.48M
Volumen operado
61.16K
Pips ganados
15
Ventas
1.43K
Instalaciones gratis