
Moving Average Plus
Indicador
144 descargas
Versión 1.0, Aug 2025
Windows, Mac
Desde 26/05/2025
449.3M
Volumen operado
61.1K
Pips ganados
15
Ventas
1.43K
Instalaciones gratis
Descripción
Global
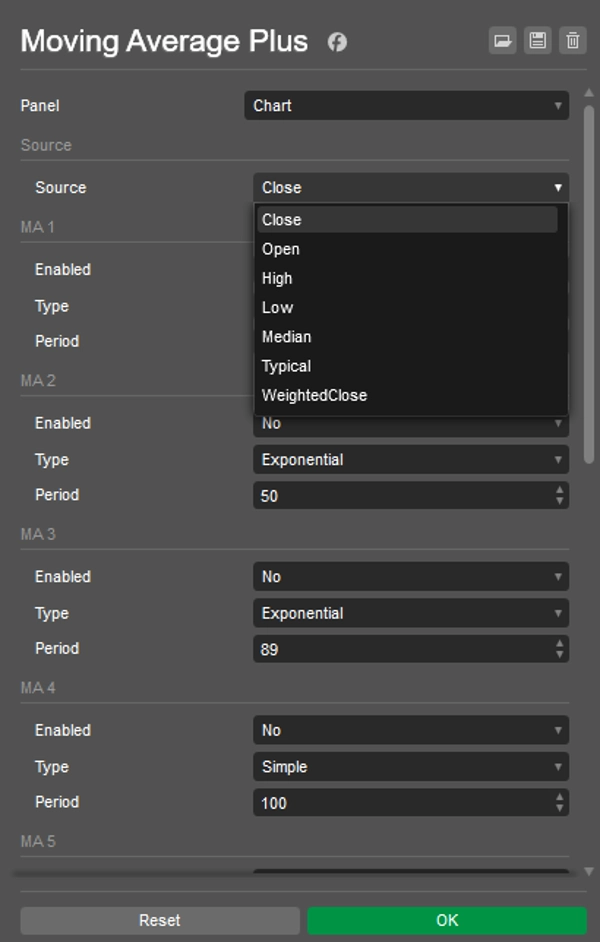
- Fuente – entrada de precio usada por todas las líneas: Cierre, Apertura, Máximo, Mínimo, Mediana, Típico o Cierre Ponderado.
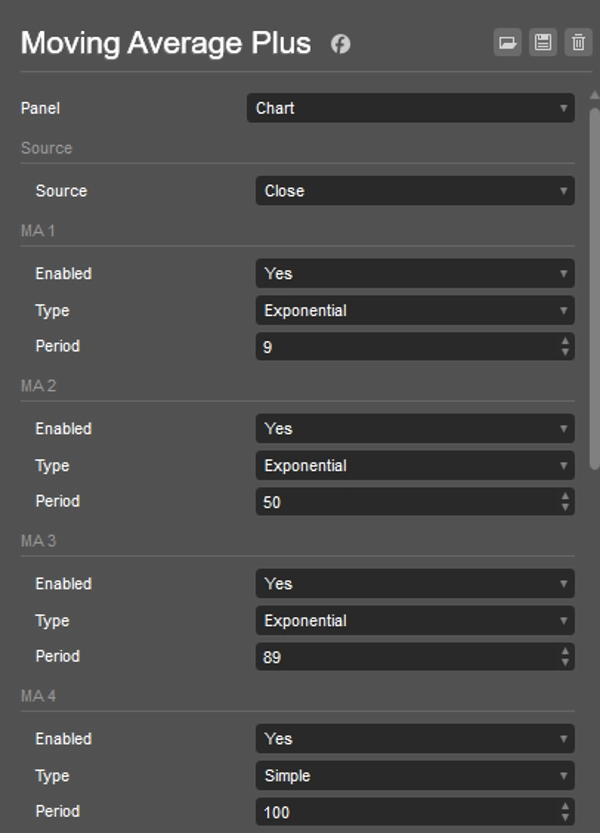
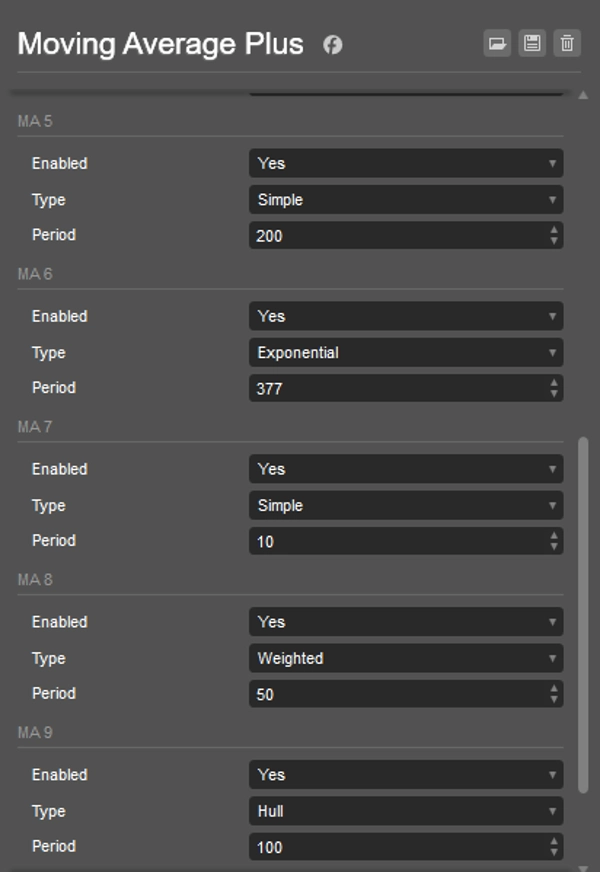
Por línea (MA 1 … MA 10)
- Habilitado – activar o desactivar la línea (las líneas deshabilitadas no se calculan).
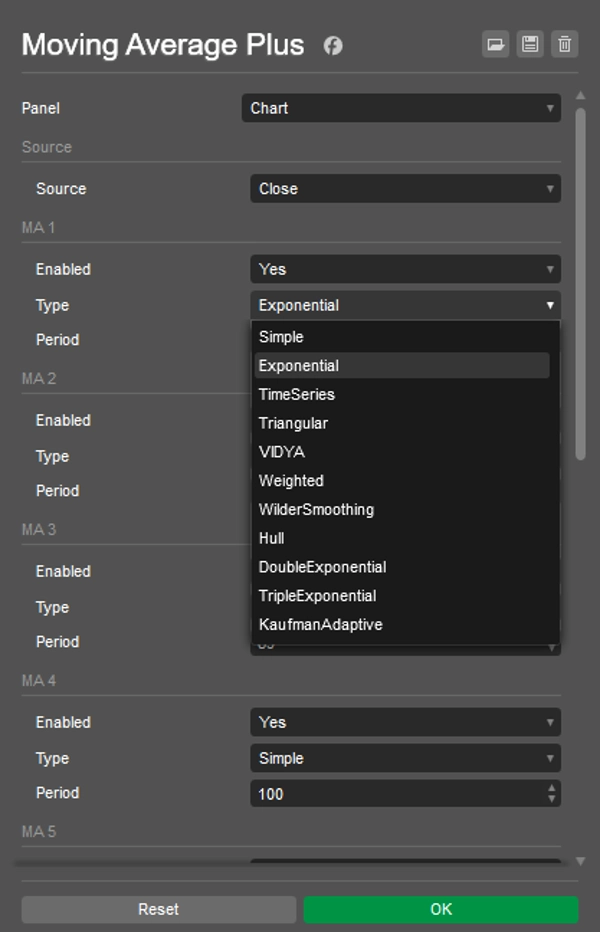
- Tipo – elige cualquiera de
MovingAverageTypede cTrader (por ejemplo, Simple, Exponencial, Ponderado, Suavizado Wilder, Hull, Triangular, Series Temporales, etc.).
Nota: algunos tipos dependen de tu versión de cTrader; si un tipo no está disponible (por ejemplo, Hull), elige otro. - Periodo – longitud del MA (≥1).
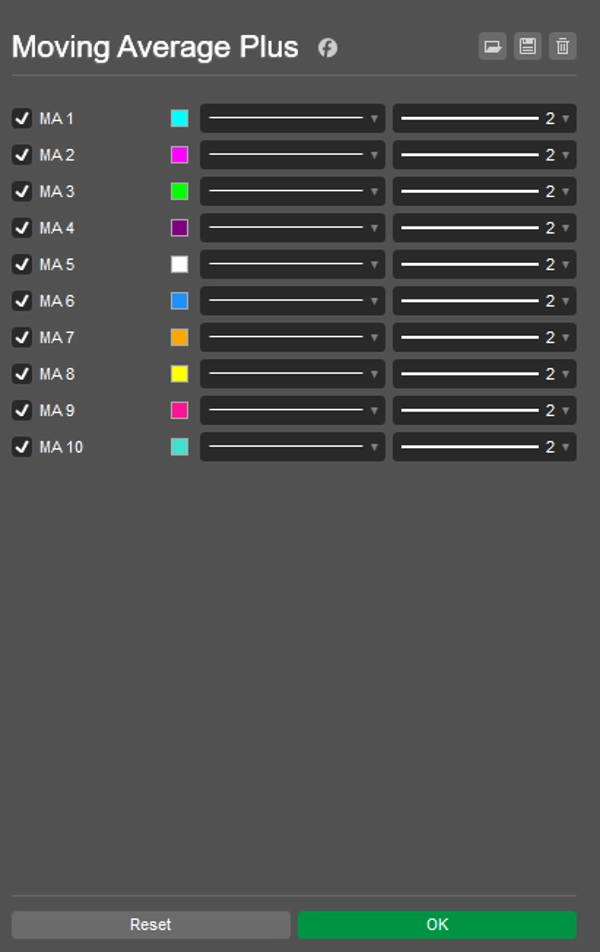
Colores y grosor
- Se configuran en la pestaña Colores de los parámetros del indicador para cada salida (“MA 1” … “MA 10”).
Consejos
- Para mejorar el rendimiento, desactiva las líneas no usadas.
- Si cambias Fuente o Tipo/Periodo, el indicador se recalcula automáticamente.
- Wilder en cTrader se llama Suavizado Wilder (
MovingAverageType.WilderSmoothing).
Resumen
Resumen de IA
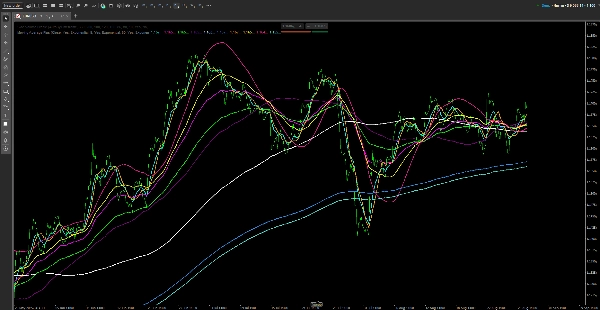
Moving Average Plus is a technical indicator for trading platforms that provides up to 10 configurable moving average lines. Each line can be individually enabled or disabled to optimize performance. Users select a single price source—such as Close, Open, High, Low, Median, Typical, or Weighted Close—that applies to all moving averages. For each line, the type of moving average can be chosen from various options including Simple, Exponential, Weighted, Wilder Smoothing, Hull, Triangular, and Time Series, depending on platform support. The period (length) of each moving average is adjustable with a minimum of 1. Colors and line thickness for each moving average are customizable through the indicator’s color settings. The indicator automatically recalculates when changes are made to the price source, type, or period. This tool is designed to assist traders in analyzing price trends by overlaying multiple moving averages with flexible configurations on their charts.
Perfil del indicador
Valoraciones de clientes
0.0
Valoraciones: 0
Valoraciones de clientes
Este producto todavía no se ha valorado. ¿Ya lo ha probado? Sea el primero en informar a otros.
Conversación
Preguntas frecuentes
Los productos disponibles a través de cTrader Store, incluidos bots, indicadores y plugins para operar, son proporcionados por desarrolladores de terceros y están disponibles únicamente con fines informativos y de acceso técnico. cTrader Store no es un bróker, por lo que no proporciona asesoramiento de inversión, recomendaciones personales ni ninguna garantía de rentabilidad futura.


Precio
Desde 26/05/2025
449.3M
Volumen operado
61.1K
Pips ganados
15
Ventas
1.43K
Instalaciones gratis