
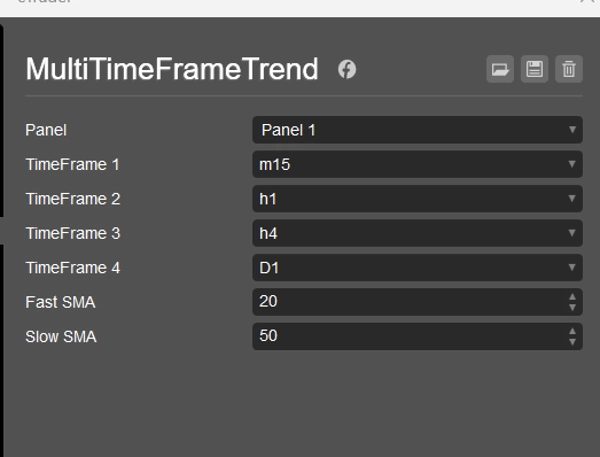
Multi Timeframe Trend Dots es un indicador de tendencia poderoso y minimalista diseñado para cTrader. Permite a los traders seguir visualmente la dirección de la tendencia a través de hasta 4 marcos de tiempo seleccionables usando líneas de puntos codificadas por colores simples pero efectivas.
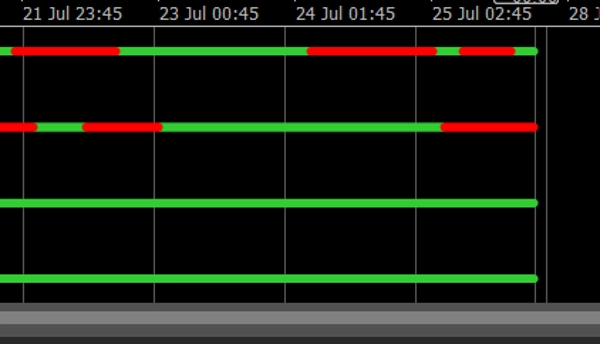
✅ Verde = Tendencia alcista
✅ Rojo = Tendencia bajista
✅ Diseño limpio en una sola subventana
✅ Configuración personalizable de SMA rápida/lenta
✅ Funciona en cualquier símbolo y marco de tiempo
Ya seas un scalper, trader intradía o trader swing, este indicador te ofrece una vista rápida de la alineación multitemporal — ideal para hacer entradas con confianza o filtrar configuraciones malas.
💼 Incluye:
- Lógica de tendencia basada en cruce de SMA
- Colocación de puntos en 4 niveles (ajustada para legibilidad)
- Etiquetas de marco de tiempo al final de cada línea de tendencia
- Totalmente compatible con todas las versiones de cTrader
🎁 Compañero perfecto para la construcción de estrategias o trading manual.
5 | 0 % | |
4 | 100 % | |
3 | 0 % | |
2 | 0 % | |
1 | 0 % |


![Logotipo de "[Hamster-Coder] Pivot Points MTF"](https://cdn.ctrader.com/image/webp/4c143e5a-309c-40e3-a578-f04d1e133ffa_31159)


