
RsiMultiFrameOBOS
Indicador
Versión 1.0, Oct 2025
Windows, Mac
4.0
Valoraciones: 1
Descripción
Descripción:
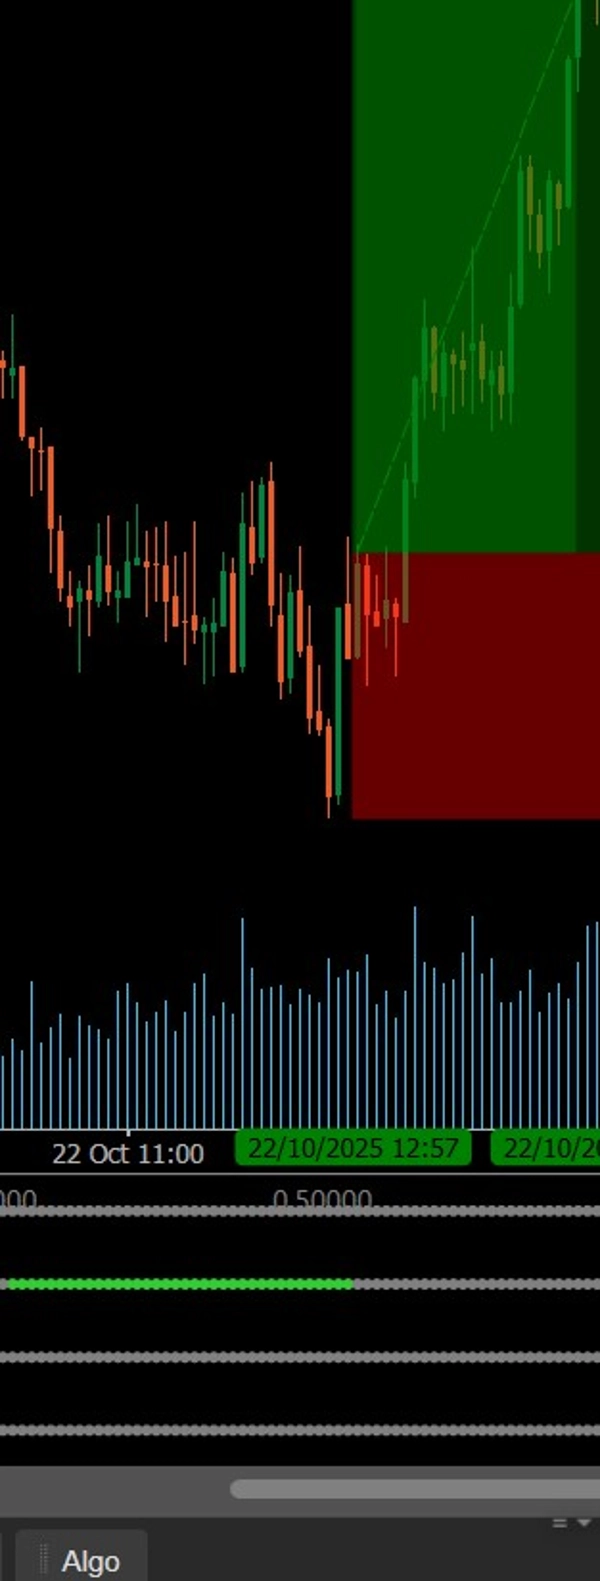
Este indicador visualiza las tendencias del RSI en cuatro marcos de tiempo personalizables usando puntos codificados por colores (verde para sobreventa, rojo para sobrecompra, gris para neutral). Ayuda a los traders a evaluar instantáneamente la alineación del impulso del mercado e identificar confirmaciones de RSI en múltiples marcos de tiempo para entradas más fuertes.
Resumen
Perfil del indicador
Valoraciones de clientes
4.0
Valoraciones: 1
5 | 0 % | |
4 | 100 % | |
3 | 0 % | |
2 | 0 % | |
1 | 0 % |
Valoraciones de clientes
November 8, 2025
A few signals across sessions tell more, and the review screen feels calmer.
Conversación
Preguntas frecuentes
BTCUSD
Prop
Forex
Scalping
Indices
EURUSD
Commodities
RSI
Crypto
Stocks
XAUUSD
Martingale
Los productos disponibles a través de cTrader Store, incluidos bots, indicadores y plugins para operar, son proporcionados por desarrolladores de terceros y están disponibles únicamente con fines informativos y de acceso técnico. cTrader Store no es un bróker, por lo que no proporciona asesoramiento de inversión, recomendaciones personales ni ninguna garantía de rentabilidad futura.
Más de este autor


Precio
Desde 21/01/2025
3
Ventas