
TradingViewMACD
Indicador
3 compras
Versión 1.0, Feb 2025
Windows, Mac
5.0
Valoraciones: 1

Descripción
Indicador TradingViewMACD
Mejore su estrategia de trading con nuestro indicador TradingViewMACD altamente personalizable, diseñado para la plataforma cAlgo. Esta poderosa herramienta combina la flexibilidad y precisión necesarias para optimizar su análisis de mercado.
Características clave:
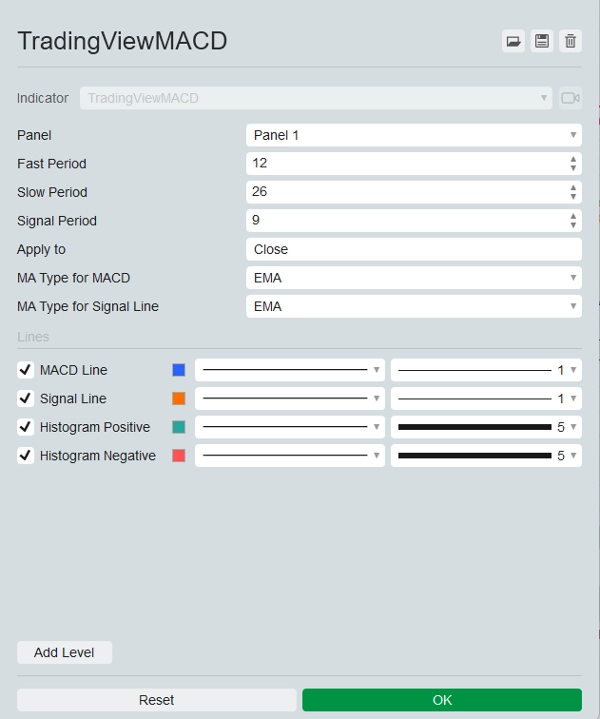
- Parámetros personalizables:
-
- Periodo rápido: Ajuste el periodo de la media móvil rápida para adaptarse a su estilo de trading.
- Periodo lento: Configure el periodo de la media móvil lenta para mejorar la precisión de la señal.
- Periodo de señal: Establezca el periodo de la línea de señal para afinar sus puntos de entrada y salida.
- Precio aplicado: Elija entre precios de apertura, máximo, mínimo, cierre, mediano, típico o ponderado para aplicar el indicador.
- Múltiples tipos de medias móviles:
-
- Seleccione entre Media Móvil Simple (SMA) y Media Móvil Exponencial (EMA) tanto para la línea MACD como para la línea de señal, proporcionando flexibilidad en su análisis.
- Salidas visuales:
-
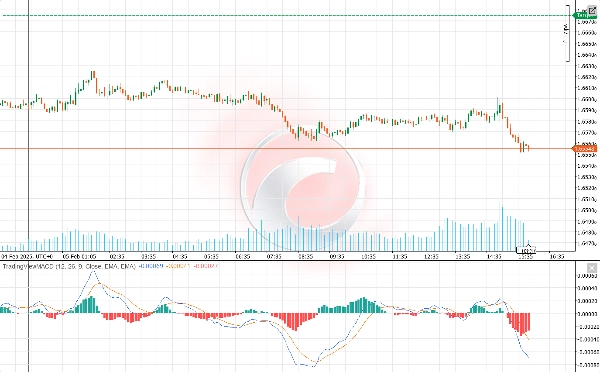
- Línea MACD: Mostrada en un llamativo color azul para una clara visibilidad.
- Línea de señal: Destacada en un vibrante color naranja para distinguirla fácilmente de la línea MACD.
- Histograma: Diferencia entre valores positivos y negativos con colores verde y rojo respectivamente, ofreciendo una clara representación visual del impulso del mercado.
- Perspectivas mejoradas del mercado:
-
- El indicador calcula la diferencia entre las medias móviles rápida y lenta para generar la línea MACD.
- Calcula la línea de señal como la media móvil de la línea MACD.
- El histograma representa visualmente la diferencia entre la línea MACD y la línea de señal, ayudándole a identificar posibles señales de compra y venta.
- Fácil de usar:
-
- Fácil de instalar y configurar, permitiendo que traders de todos los niveles se beneficien de sus funciones avanzadas.
- Documentación completa y soporte al cliente para asegurar una experiencia sin inconvenientes.
Libere todo el potencial de su estrategia de trading con el indicador TradingViewMACD. Mejore su análisis de mercado, tome decisiones informadas y manténgase a la vanguardia con esta herramienta esencial para el trading.
Resumen
Resumen de IA
The TradingViewMACD indicator for the cAlgo platform is a customizable technical analysis tool designed to enhance market analysis. It calculates the difference between fast and slow moving averages to generate the MACD line, computes a signal line as the moving average of the MACD line, and displays a histogram representing the difference between these lines to help identify potential buy and sell signals.
Key features include adjustable parameters such as fast period, slow period, signal period, and applied price (open, high, low, close, median, typical, or weighted). Users can select between Simple Moving Average (SMA) and Exponential Moving Average (EMA) types for both the MACD and signal lines, providing analytical flexibility.
Visual outputs consist of a blue MACD line, an orange signal line, and a histogram with green and red colors indicating positive and negative momentum, respectively. The indicator is designed for ease of installation and configuration, supported by comprehensive documentation and customer support to accommodate traders of all experience levels.
Perfil del indicador
Valoraciones de clientes
5.0
Valoraciones: 1
5 | 100 % | |
4 | 0 % | |
3 | 0 % | |
2 | 0 % | |
1 | 0 % |
Valoraciones de clientes
November 9, 2025
TradingView MACD brings the familiar feel straight to cTrader 🚀 - smooth, light, and 100% accurate to the original. Perfect for traders switching from TV who love clean momentum signals. Missing alerts, but flawless for classic trend and divergence play.
Conversación
Preguntas frecuentes
Signal
MACD
Los productos disponibles a través de cTrader Store, incluidos bots, indicadores y plugins para operar, son proporcionados por desarrolladores de terceros y están disponibles únicamente con fines informativos y de acceso técnico. cTrader Store no es un bróker, por lo que no proporciona asesoramiento de inversión, recomendaciones personales ni ninguna garantía de rentabilidad futura.


Precio
Desde 22/11/2024
133
Ventas
2.58K
Instalaciones gratis