
session indicator
Indicador
7 compras
Versión 1.0, May 2025
Windows, Mac
4.3
Valoraciones: 3
Descripción
Visualiza las principales sesiones del mercado + niveles altos/bajos con precisión
El Indicador de Sesiones de Trading resalta las sesiones de trading más importantes — Londres, Nueva York, y Tokio — directamente en tu gráfico. Ya seas scalper o trader de swing, saber cuándo la volatilidad aumenta o disminuye es crucial. Esta herramienta te brinda esa ventaja con claridad.
✅ Características clave:
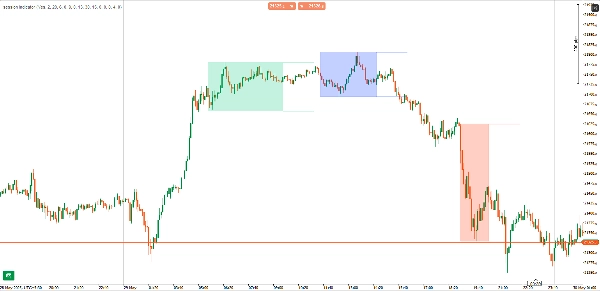
- Rectángulos de sesión: Resalta visualmente cada sesión con cuadros sombreados opcionales
- Líneas de alto/bajo: Traza los máximos y mínimos de la sesión con longitud de extensión personalizable
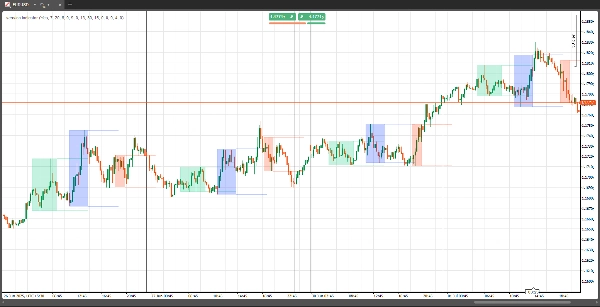
- Vista histórica: Visualiza datos de sesión para el día actual o cualquier número de días anteriores
- Totalmente personalizable: Configura las horas de inicio/fin de sesión, activa o desactiva los rectángulos y define hasta dónde se extienden las líneas
- Soporte para múltiples marcos temporales: Funciona en todos los marcos temporales del gráfico
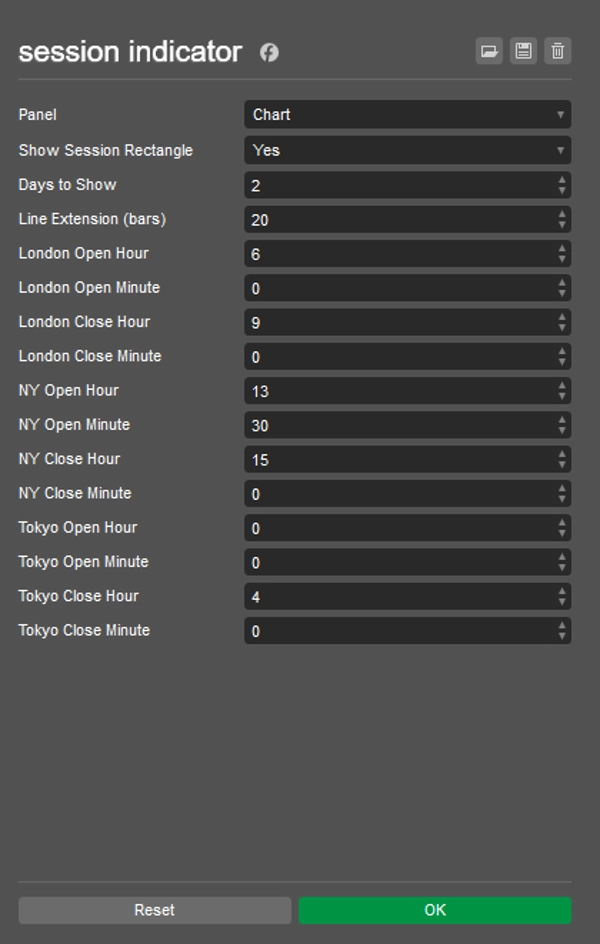
🔧 Parámetros:
- Horarios de sesión: Hora de inicio/fin personalizada para Londres, NY y Tokio
- Mostrar rectángulo: Activa o desactiva los cuadros sombreados de sesión
- Días a mostrar: Número de días históricos para mostrar datos de sesión
- Barras de extensión de línea: Controla hasta dónde se extienden las líneas de alto/bajo de sesión en el gráfico
🧠 ¿Por qué usarlo?
Comprender los patrones de volatilidad basados en sesiones es una piedra angular del trading institucional. Este indicador te ayuda a:
- Temporizar entradas y salidas alrededor de zonas clave de liquidez
- Identificar los máximos y mínimos de sesión para estrategias de ruptura o reversión
- Separar visualmente las superposiciones de sesión (p. ej., Londres–NY)
Resumen
Resumen de IA
The Session Indicator is a charting tool designed to highlight key global trading sessions—London, New York, and Tokyo—directly on trading charts. It visually marks each session with optional shaded rectangles and plots session high and low price levels, with customizable line extension lengths. Users can view session data for the current day or multiple previous days, supporting analysis across various timeframes.
Key features include full customization of session start and end times, toggling of session rectangles, and control over how far high/low lines extend. The indicator works on all chart timeframes and helps traders identify volatility patterns associated with institutional trading sessions.
This tool aids in timing entries and exits around key liquidity zones, recognizing session highs and lows for breakout or reversal strategies, and visually distinguishing overlapping sessions such as London-New York. It supports markets including Forex, indices, and major symbols like NAS100. The indicator outputs visual signals based on market structure concepts and is suitable for traders employing reversal strategies.
Perfil del indicador
Categoría del indicador
Estructura del mercado (SMC)
Tipo de resultado
Visualización
Requisitos de datos
Únicamente barras
Señales admitidas
Inversión
Valoraciones de clientes
4.3
Valoraciones: 3
5 | 67 % | |
4 | 0 % | |
3 | 33 % | |
2 | 0 % | |
1 | 0 % |
Valoraciones de clientes
June 2, 2025
Useful setup helper for traders who care about timing windows. It gives value around session timing, but the value depends on the trader's schedule. I would compare Asia range, London break and New York continuation before trusting it. The tool is most useful when it keeps the trader out of dead hours.
June 1, 2025
June 1, 2025
Decent trade support for session timing. it helps match setups with active market hours, especially when used for planning trades around active sessions. The session view is useful for London and New York, especially when checking the first 60 minutes. The tool is most useful when it keeps the trader out of dead hours.
Conversación
Preguntas frecuentes
Prop
Forex
Indices
Fair Value Gap
SMC
NAS100
Los productos disponibles a través de cTrader Store, incluidos bots, indicadores y plugins para operar, son proporcionados por desarrolladores de terceros y están disponibles únicamente con fines informativos y de acceso técnico. cTrader Store no es un bróker, por lo que no proporciona asesoramiento de inversión, recomendaciones personales ni ninguna garantía de rentabilidad futura.


![Logotipo de "[Hamster-Coder] Moving Average MTF"](https://cdn.ctrader.com/image/webp/b11b98b1-194d-4b8e-b00e-d611826ad159_31226)


Precio
Desde 30/05/2025
40
Ventas