
support and resistance
مؤشر
13 عمليات الشراء
الإصدار 1.0، Jun 2025
Windows, Mac
4.3
التقييمات: 3
الوصف
الميزات الرئيسية:
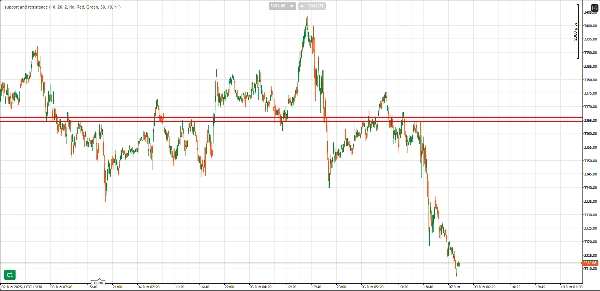
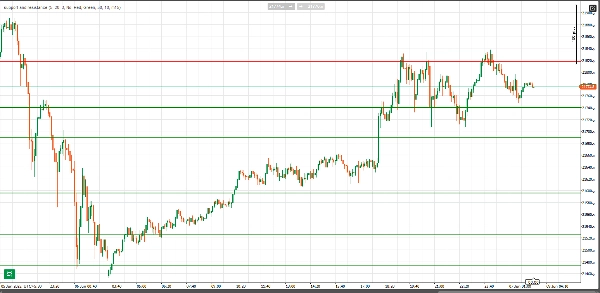
- الكشف التلقائي عن الدعم والمقاومة: يقوم المؤشر تلقائيًا بتحديد مستويات الدعم والمقاومة الهامة بناءً على حركة السعر، مبرزًا هذه المناطق حيث انعكس السعر أو توقف عدة مرات.
- التحقق من عدد الارتدادات: يتم التحقق من مستويات الدعم والمقاومة بناءً على عدد الارتدادات (ردود فعل السعر) من المستوى. كلما زاد عدد الارتدادات، كان المستوى أقوى. يمكنك ضبط الحد الأدنى لعدد الارتدادات ليتم اعتبار المستوى صالحًا، مما يضمن تمييز المستويات ذات الأهمية العالية فقط.
- أنماط الخطوط القابلة للتعديل: يتم تعديل سمك ونمط خطوط الدعم والمقاومة تلقائيًا بناءً على عدد الارتدادات. يتم رسم المستويات التي تحتوي على مزيد من الارتدادات بخطوط أكثر سمكًا وبروزًا، مما يبرز أهميتها بصريًا.
- عرض المنطقة (نقاط): يمكنك تحديد منطقة عازلة حول مستويات الدعم والمقاومة بالنقاط. يساعد هذا في تحديد حركة السعر ضمن نطاق حيث يمكن أن ينعكس السعر أو يتفاعل.
- مرشح الإطار الزمني الأعلى: ميزة فريدة لهذا المؤشر هي قدرته على التحقق من صحة مستويات الدعم والمقاومة باستخدام مرشح الإطار الزمني الأعلى. من خلال اختيار إطار زمني أعلى (مثل 1H، 4H)، يقوم المؤشر بمراجعة المستويات المحددة مقابل حركة السعر الرئيسية في الإطار الزمني الأعلى، مما يضمن رسم المستويات الهامة فقط على الرسم البياني.
- التنبيهات: عندما يدخل السعر منطقة مستوى دعم أو مقاومة، يمكن للمؤشر تنبيهك بصوت، حتى لا تفوت أي رد فعل هام للسعر.
- ألوان قابلة للتخصيص: يمكنك بسهولة تغيير لون خطوط الدعم والمقاومة لتناسب تفضيلاتك أو تتماشى مع موضوع التداول الخاص بك.
- منع التداخل: يتضمن المؤشر مرشح العتبة الذي يمنع رسم مستويات الدعم والمقاومة المتداخلة والقريبة جدًا من بعضها البعض، مما يضمن عرض المستويات الفريدة والهامة فقط.
الفوائد:
- توفير الوقت: اكتشف بصريًا وبشكل تلقائي مستويات الدعم والمقاومة الرئيسية دون الحاجة لرسمها يدويًا.
- رؤية واضحة: شاهد بسهولة أي مستويات الدعم والمقاومة هي الأكثر أهمية بناءً على ارتدادات السعر والتحقق من الإطار الزمني الأعلى.
- تنبيهات فعالة: استلم تنبيهات في الوقت المناسب عندما تدخل حركة السعر مستويات هامة، مما يساعدك على التصرف بسرعة وكفاءة.
- تحسين قرارات التداول: استخدم هذا المؤشر لتعزيز ثقتك في نقاط الدخول والخروج، وكذلك في تحليلك الفني العام.
خيارات التخصيص:
- أشرطة النظر إلى الوراء: اضبط مدى النظر إلى الوراء الذي يستخدمه المؤشر لتحديد مستويات الدعم والمقاومة المحتملة.
- الحد الأدنى للارتدادات: حدد الحد الأدنى لعدد الارتدادات المطلوبة ليتم اعتبار المستوى صالحًا.
- الإطار الزمني الأعلى: قم بتصفية مستويات الدعم والمقاومة بناءً على إطار زمني أعلى (مثل مخططات الساعة الواحدة، الأربع ساعات).
- لون الخط: اختر ألوانًا لخطوط المقاومة والدعم لتناسب نمط الرسم البياني الخاص بك.
- إعدادات التنبيه: قم بتمكين أو تعطيل التنبيهات بناءً على دخول السعر مناطق الدعم أو المقاومة.
الملخص
ملخص الذكاء الاصطناعي
This indicator automatically detects key support and resistance levels by analyzing price action and identifying zones where price has reversed or stalled multiple times. It validates these levels based on the number of price bounces, allowing users to set a minimum bounce count to highlight only significant levels. The indicator visually emphasizes stronger levels by adjusting line thickness and style according to bounce count. Users can define a buffer zone around levels in pips to capture price reactions within a range.
A higher timeframe filter cross-checks identified levels against price action on selected higher timeframes (e.g., 1-hour, 4-hour), ensuring only important levels are displayed. Alerts notify users with audio signals when price enters support or resistance zones. The indicator prevents overlapping lines by applying a threshold filter, maintaining clarity on the chart. Colors of support and resistance lines are customizable to fit user preferences.
Customization options include adjusting lookback bars, minimum bounces, higher timeframe selection, line colors, and alert settings. This tool supports markets such as Forex, commodities, indices, and popular symbols including BTCUSD, EURUSD, GBPUSD, XAUUSD, NAS100, and USDJPY. It aids traders in saving time, improving visual clarity, receiving timely alerts, and making more confident trading decisions.
ملف تعريف المؤشر
فئة المؤشر
الدعم والمقاومة
نوع المخرجات
التصور
متطلبات البيانات
أعمدة السعر فقط
الإشارات المدعومة
الانقطاع
الانعكاس
تقييمات العملاء
4.3
التقييمات: 3
5 | 33 % | |
4 | 67 % | |
3 | 0 % | |
2 | 0 % | |
1 | 0 % |
تقييمات العملاء
June 11, 2025
Nice setup companion for a more controlled workflow. It helps with planning entries and exits around important areas, but not every zone holds, even if it looks clean. The cleanest use is 3 to 5 levels per chart, with 0.5 pullbacks checked before entry. I would still keep manual review in the process.
June 10, 2025
June 10, 2025
Decent option for checks around key price zones. The useful part is planning entries and exits around important areas, with the numbers checked before scaling. I would wait for 2 reactions and avoid trades where the target is less than 1.5R. Levels are useful when they reduce noise, not when they crowd the chart.
مناقشة
الأسئلة الشائعة
BTCUSD
Prop
Forex
Breakout
Indices
EURUSD
Commodities
GBPUSD
NZDUSD
XAUUSD
NAS100
USDJPY
يتم توفير المنتجات المتاحة من خلال cTrader Store، بما في ذلك روبوتات التداول والمؤشرات والإضافات، من قبل مطوري الطرف الثالث وإتاحتها لأغراض الوصول المعلوماتي والفني فقط. cTrader Store ليس وسيطًا ولا يقدم نصائح استثمارية أو توصيات شخصية أو أي ضمان للأداء المستقبلي.


السعر
منذ 30/05/2025
40
المبيعات