

VWAP Stdev Bands
Indicador
Versión 1.0, Jul 2026
Windows, Mac

534.4M
Volumen operado
9.76M
Pips ganados
4
Ventas
Descripción
Descripción y Reglas de Trading (Versión en Inglés)
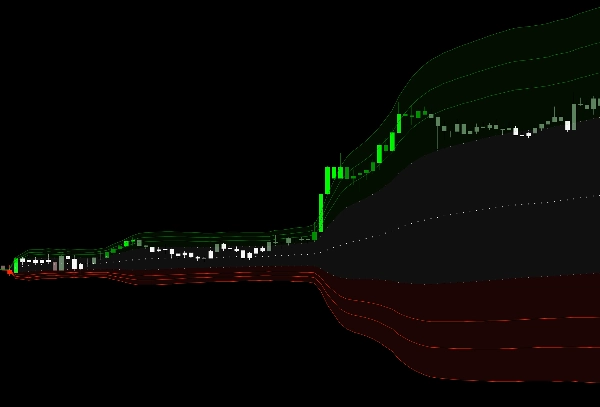
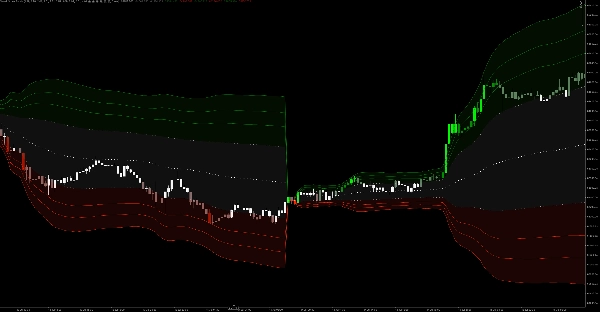
【Resumen del Indicador】 Este indicador gira en torno al VWAP Diario (Precio Promedio Ponderado por Volumen) y se expande hacia afuera con 5 niveles de bandas de Desviación Estándar (Stdev). Combinado con nuestra tecnología única de coloreado "Mapa de Calor de Velas", no solo muestra zonas dinámicas de soporte y resistencia, sino que también resalta visualmente condiciones extremas de sobrecompra y sobreventa en el mercado, ayudando a los traders a capturar con precisión oportunidades de reversión a la media.
【Reglas de Trading】
- Zona de Consolidación y Observación (Blanco / Verde Oscuro / Rojo Oscuro): Cuando las velas permanecen dentro de las bandas de desviación estándar 1 y 2, el precio fluctúa normalmente alrededor del promedio móvil. Se recomienda seguir la tendencia o mantenerse al margen.
- Zona de Tendencia Direccional (Verde / Rojo Intenso): Cuando las velas rompen la segunda banda y entran en la tercera, la tendencia entra en una fase de aceleración con un fuerte impulso.
- Zona de Reversión Extrema (Lima / Rojo Brillante): Cuando las velas alcanzan las bandas de desviación estándar cuarta o quinta y el color cambia al Lima más brillante o Rojo, indica un sentimiento de mercado extremadamente sobrecomprado o sobrevendido. Es muy probable que ocurra una "reversión a la media" (reversión brusca), sirviendo como una excelente señal para tomar ganancias o realizar entradas contrarias (apostar contra el máximo/mínimo).
Resumen
AI summary
VWAP Stdev Bands is a technical indicator centered on the Daily Volume Weighted Average Price (VWAP) enhanced with five tiers of standard deviation bands. It integrates a dynamic candlestick heatmap coloring system to visually represent support and resistance levels and highlight extreme market conditions. The indicator categorizes price action into zones: a consolidation zone within the first two standard deviation bands indicating normal fluctuation; a directional trend zone beyond the second band signaling strong momentum; and an extreme reversion zone at the fourth and fifth bands, marking overbought or oversold conditions likely to precede sharp reversals. This structure assists traders in identifying mean reversion opportunities and momentum phases. The indicator supports volume and bar data inputs and provides visual outputs suitable for trend analysis, volatility regime detection, reversal signals, breakouts, and level touches or breaks. It is designed for use in markets where VWAP and volume data are available.
Perfil del indicador
Categoría del indicador
Tendencia
Tipo de resultado
Visualización
Requisitos de datos
Únicamente barras
Volumen
Señales admitidas
Volatilidad
Fuerza de la tendencia
Inversión
Ruptura
Toque de nivel
Ruptura de nivel
Valoraciones de clientes
0.0
Valoraciones: 0
Valoraciones de clientes
Este producto todavía no se ha valorado. ¿Ya lo ha probado? Sea el primero en informar a otros.
Conversación
Preguntas frecuentes
Volume
Moving Average
VWAP
Support & Resistance
Los productos disponibles a través de cTrader Store, incluidos bots, indicadores y plugins para operar, son proporcionados por desarrolladores de terceros y están disponibles únicamente con fines informativos y de acceso técnico. cTrader Store no es un bróker, por lo que no proporciona asesoramiento de inversión, recomendaciones personales ni ninguna garantía de rentabilidad futura.
Más de este autor






















Precio
534.4M
Volumen operado
9.76M
Pips ganados
4
Ventas