
Frac Support Resistance V1
مؤشر
2 عمليات الشراء
الإصدار 1.0، Nov 2025
Windows, Mac
5.0
التقييمات: 1
الوصف
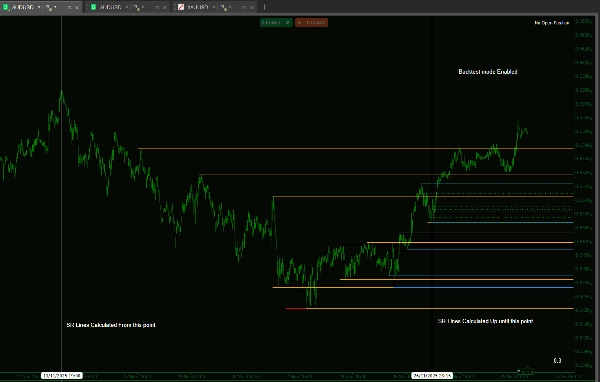
إذا كنت تتداول بناءً على هيكل السوق، فأنت تعلم أن المستويات الأكثر أهمية غالبًا ما تُحدد على إطار زمني أعلى. يحل هذا المؤشر المخصص مشكلة الإحباط الناتج عن تحديد وتتبع تلك المستويات يدويًا.
تم تصميم هذه الأداة لتوفير تسلسل هرمي بصري موثوق، مما يضمن لك رؤية الحدود الهيكلية الحرجة وإعطاء الأولوية للمناطق ذات القيمة العالية دون مغادرة شاشة التنفيذ الخاصة بك.
الميزات الرئيسية والتحكم الدقيق
- تم بناء المؤشر لأداء استثنائي وتصوير بياني نظيف:
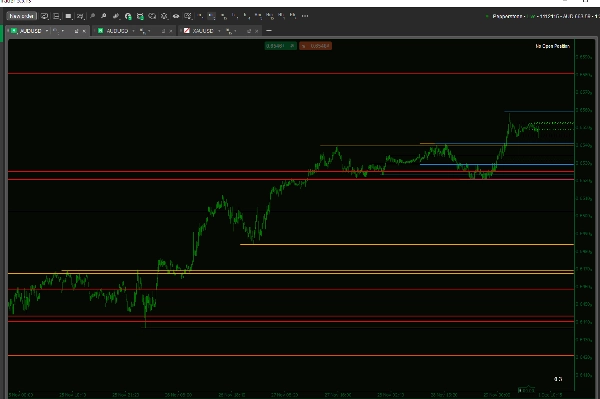
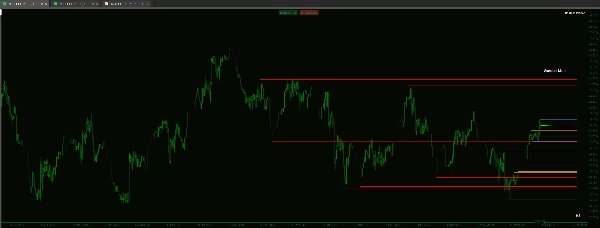
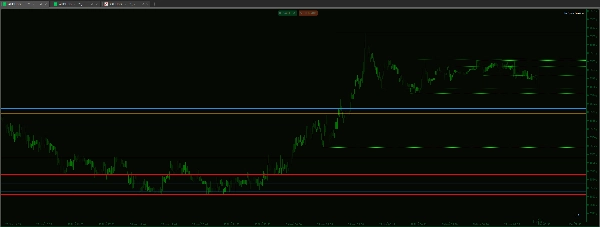
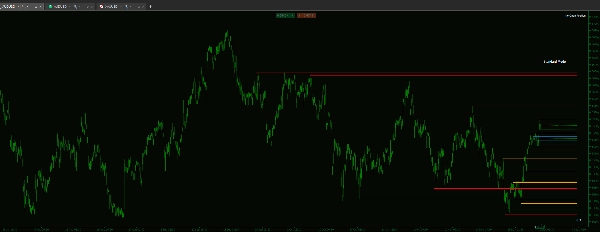
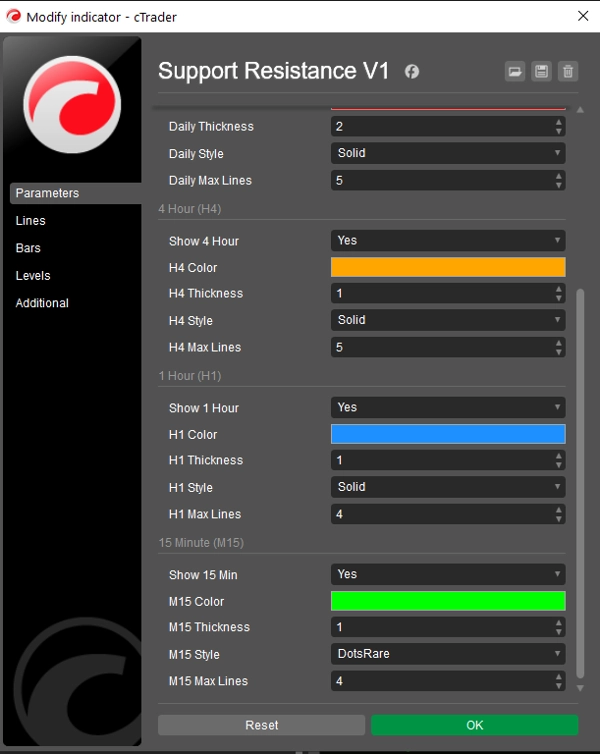
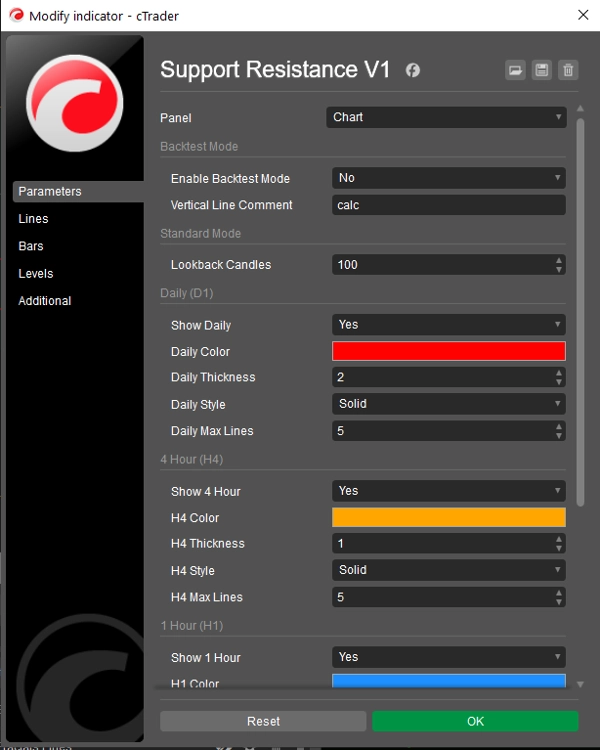
- تسلسل هرمي بصري حقيقي: احصل على تحكم مستقل في السماكة، ونمط الخط (صلب، متقطع، منقط)، واللون لكل إطار زمني على حدة.
- الفائدة: تعرف فورًا على قوة المستوى بمجرد مظهره (مثلاً، ضبط خطوط D1 لتكون سميكة/صلبة للهيكل الرئيسي وخطوط H1 لتكون رفيعة/منقطة للمستويات الفورية).
- الأداء والتحكم في التركيز: هل سئمت من الرسوم البيانية المزدحمة؟ يمكنك تحديد الحد الأقصى لعدد الخطوط المعروضة لكل إطار زمني بشكل فردي.
- مثال: ضبط الحد الأقصى لخطوط H4 على 5 وخطوط D1 على 15 لإعطاء الأولوية للمستويات الحديثة على الأطر الزمنية الأقل مع الحفاظ على رؤية أعمق للهياكل الرئيسية.
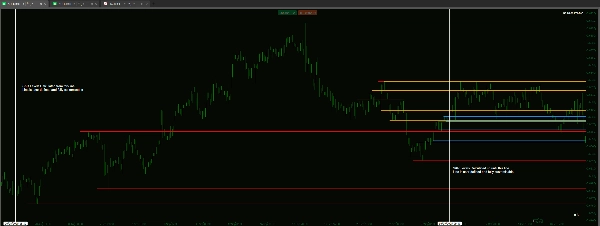
- أساس كود نظيف: مبني على منطق فراكتالي موثوق، مما يضمن أن المستويات المحددة هي نقاط تحول عالية/منخفضة حقيقية تُستخدم في تحليل الهيكل القياسي.
- وضع اختبار خلفي مخصص: يتضمن وظيفة لتقييد تحليل المؤشر على نطاق زمني محدد ومعرف على الرسم البياني. هذا ضروري لاختبار خلفي يدوي دقيق من خلال محاكاة تقدم الوقت بدون تحيز مستقبلي.
الملخص
ملخص الذكاء الاصطناعي
Frac Support Resistance V1 is a technical indicator designed to automatically calculate and display smart support and resistance lines derived from multiple timeframes: daily (D1), 4-hour (H4), hourly (H1), and 15-minute (M15). It assists traders who rely on market structure by visually highlighting critical price levels established on higher timeframes, reducing the need for manual identification.
Key features include customizable visual hierarchy, allowing independent adjustment of line thickness, style (solid, dashed, dotted), and color for each timeframe. This enables quick recognition of the relative strength of support and resistance levels. Users can also control chart clarity by setting maximum numbers of lines per timeframe to prioritize recent or major structural levels.
The indicator is based on fractal logic to identify genuine high and low pivots consistent with standard market structure analysis. It includes a dedicated backtesting mode that restricts analysis to a specified historical period, facilitating unbiased manual strategy testing by simulating real-time progression.
Frac Support Resistance V1 supports various markets including Forex, cryptocurrencies, commodities, indices, and stocks, with tags indicating compatibility with symbols like BTCUSD, EURUSD, GBPUSD, XAUUSD, NAS100, and USDJPY. The tool is suited for strategies involving breakout, scalping, smart money concepts, and grid trading.
ملف تعريف المؤشر
تقييمات العملاء
5.0
التقييمات: 1
5 | 100 % | |
4 | 0 % | |
3 | 0 % | |
2 | 0 % | |
1 | 0 % |
تقييمات العملاء
December 1, 2025
A small account test feels safer, and the plan becomes easier to stick with, and the chart still needs a final look.
مناقشة
الأسئلة الشائعة
BTCUSD
Forex
Signal
Breakout
Indices
EURUSD
Commodities
GBPUSD
NZDUSD
Prop
Scalping
SMC
Crypto
Grid
Stocks
AI
XAUUSD
NAS100
USDJPY
يتم توفير المنتجات المتاحة من خلال cTrader Store، بما في ذلك روبوتات التداول والمؤشرات والإضافات، من قبل مطوري الطرف الثالث وإتاحتها لأغراض الوصول المعلوماتي والفني فقط. cTrader Store ليس وسيطًا ولا يقدم نصائح استثمارية أو توصيات شخصية أو أي ضمان للأداء المستقبلي.


السعر
منذ 14/01/2025
55
المبيعات
11.31K
التثبيتات المجانية