
Volume Profile Triple Line - POC Median Mode
Индикатор
4 покупки
Версия 1.0, Feb 2025
Windows, Mac
4.0
Отзывы: 2
Описание
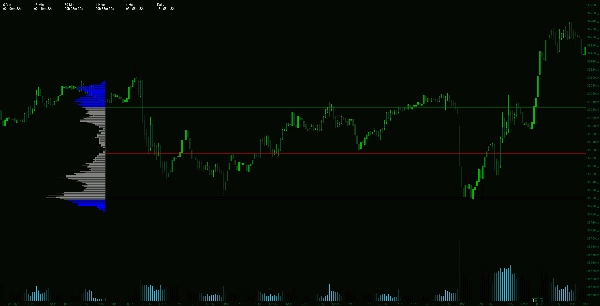
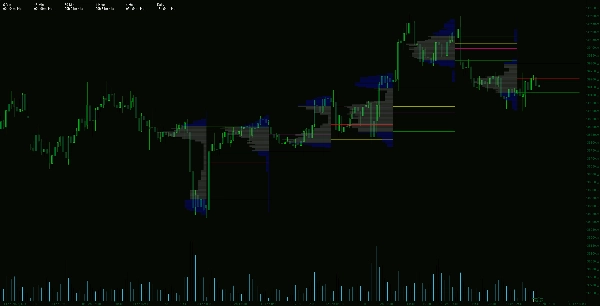
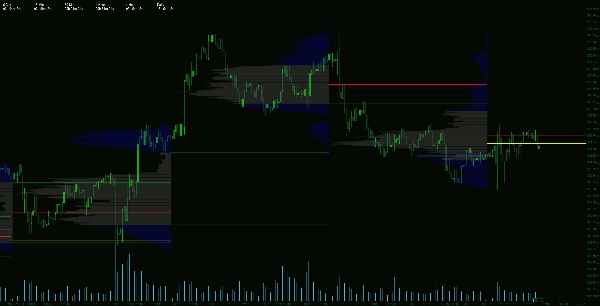
Индикатор расширенного профиля объема — это профессиональный торговый инструмент, предназначенный для глубокого анализа рынка с помощью объема. Он вычисляет точку контроля (POC), медиану и моду, предоставляя точное представление о ценовых уровнях, где происходит значительная рыночная активность.
Ключевые особенности:
Сводка
ИИ-сводка
The Advanced Volume Profile Indicator is a professional trading tool that analyzes market volume to identify key price levels. It calculates the Point of Control (POC), Median, and Mode, highlighting price points with the highest traded volume and providing statistical insights into price balance and trend strength. The indicator displays the previous day's volume distribution and volume curve, then projects key levels such as Value Area High (VAH), Value Area Low (VAL), POC, Median, and Mode onto the following day. This helps traders identify support and resistance zones, volume gaps, and areas of accumulation or distribution. By leveraging volume-based data, users can refine trade entries, exits, and stop-loss placements for improved market positioning. The indicator requires significant memory resources due to its detailed volume distribution calculations.
Профиль индикатора
Отзывы покупателей
4.0
Отзывы: 2
5 | 0 % | |
4 | 100 % | |
3 | 0 % | |
2 | 0 % | |
1 | 0 % |
Отзывы покупателей
February 26, 2025
A few ugly trades are useful in the sample, and the log becomes easier to read.
February 20, 2025
It becomes more useful when fewer random clicks reach the trade log, and 20 reactions is a fair first sample.
Обсуждение
Частые вопросы
Продукты, доступные в cTrader Store, включая торговых ботов, индикаторы и плагины, предоставляются сторонними разработчиками и доступны исключительно в информационных и технических целях. cTrader Store не является брокером и не предоставляет инвестиционные консультации, персональные рекомендации или какие-либо гарантии будущей доходности.


Цена
С 14/01/2025
55
Продажи
11.31K
Бесплатные установки