present
Zarejestruj się i otrzymaj 50 $ zniżki na pierwszy zakup
Trading product for BubbleXRay Wskaźnik Key Levels Liquidity Sweep, image 1
BubbleXRay
Wskaźnik
18 zakupy
Wersja 1.2, Aug 2026
Windows, Mac
4.3
Opinie: 3
Trading product for BubbleXRay Wskaźnik Key Levels Liquidity Sweep, image 2
Trading product for BubbleXRay Wskaźnik Key Levels Liquidity Sweep, image 3
Trading product for BubbleXRay Wskaźnik Key Levels Liquidity Sweep, image 4
Trading product for BubbleXRay Wskaźnik Key Levels Liquidity Sweep, image 5
Trading product for BubbleXRay Wskaźnik Key Levels Liquidity Sweep, image 6
Trading product for BubbleXRay Wskaźnik Key Levels Liquidity Sweep, image 7
Trading product for BubbleXRay Wskaźnik Key Levels Liquidity Sweep, image 8
Trading product for BubbleXRay Wskaźnik Key Levels Liquidity Sweep, image 9
Od 09/02/2026
23
Sprzedaż
160
Bezpłatne instalacje

Opis

BUBBLEXRAY — NAJLEPSZY SKANER WOLUMENU BAŃKI DLA CTRADER (WERSJA 🇧🇷 PONIŻEJ)

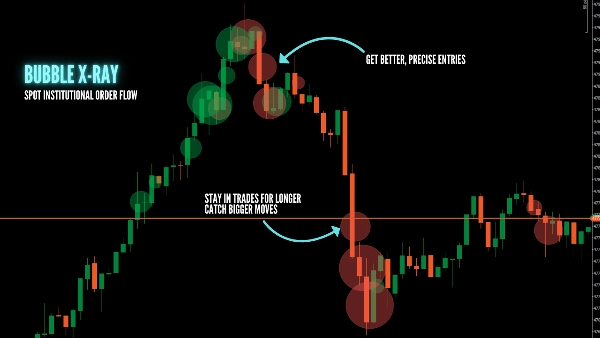
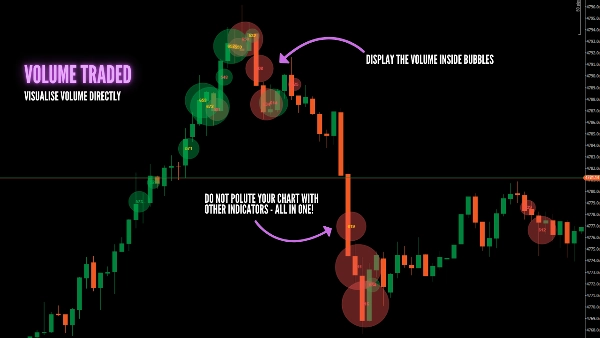
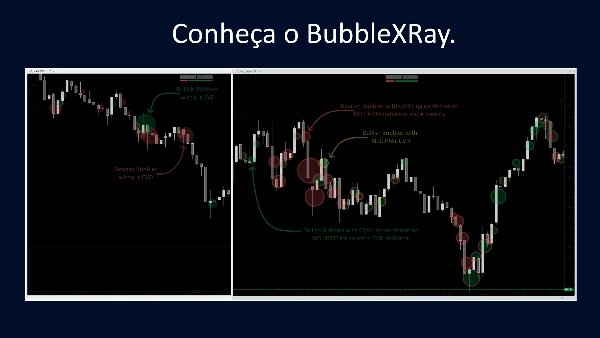
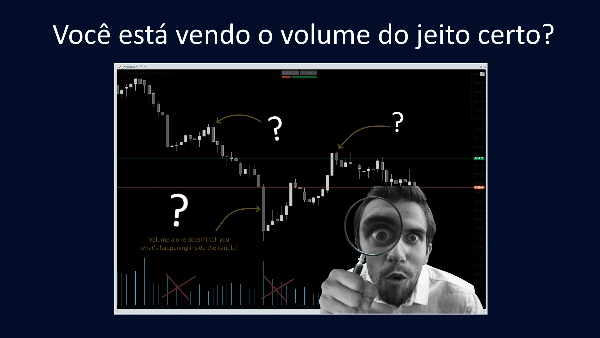
Zauważ, gdzie porusza się prawdziwe pieniądze. BubbleXRay identyfikuje skoki wysokiego wolumenu i przedstawia je jako proporcjonalne bańki bezpośrednio na wykresie cenowym. Wyświetla skumulowaną zmianę delty wolumenu (CVD) zintegrowaną w jednym wskaźniku, bez zaśmiecania lub zanieczyszczania wykresu. Koniec z domysłami — zobacz ślady instytucjonalne w momencie ich wystąpienia.

✅ DLACZEGO WARTO UŻYWAĆ BUBBLEXRAY?

  • Natychmiastowe Skoki Aktywności: Bańki pojawiają się w chwili zamknięcia słupka o wysokim wolumenie.
  • Ślady Instytucjonalne: Duże bańki na kluczowych poziomach pokazują, gdzie działają duzi gracze.
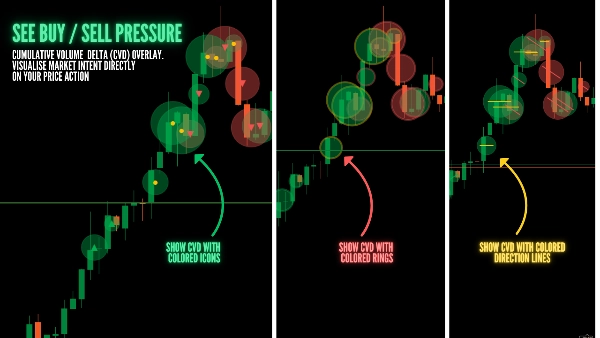
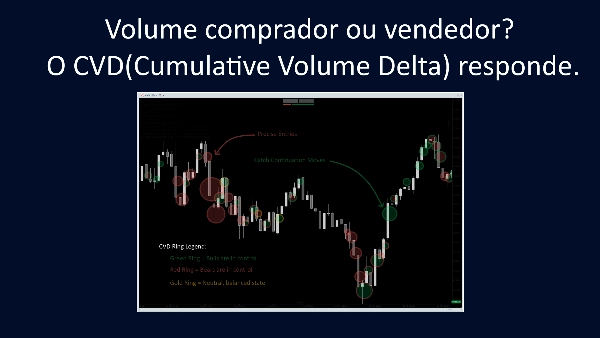
  • Inteligencja CVD: Zintegrowana skumulowana delta wolumenu pokazuje, czy wzrost był efektem presji kupna czy sprzedaży.
  • Automatyczne Skalowanie: Okno percentylowe dostosowuje się do każdej sytuacji rynkowej (trend lub konsolidacja).
  • Zakotwiczenie do Ceny: Wolumen jest wyświetlany na dokładnym poziomie cenowym, nie ukryty w histogramie pod wykresem.

Przykładowy Preset: Złoto (XAUUSD) - wykres 1M

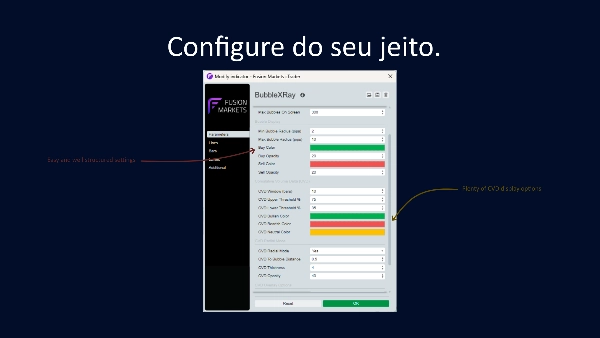
  • Próg Percentyla Wolumenu: 50
  • Okno Percentyla (słupki): 250
  • Maksymalna liczba baniek na ekranie: 20
  • Minimalny promień baniek (pipsy): 5 ➡ (przykład dla EUR/USD: 0.1)
  • Maksymalny promień baniek (pipsy): 20 ➡ (przykład dla EUR/USD: 0.8)
  • Okres kroczący CVD (słupki): 10
  • Okres patrzenia wstecz nachylenia CVD (słupki): 7
  • Współczynnik płaskości CVD: 1.8
  • Tryb radialny CVD: Nie
  • Odległość CVD do bańki: 0.5
  • Grubość CVD: 4
  • Krycie CVD: 40
  • Opcje nakładki CVD: Nie
  • Tryb debugowania: Nie

📺 OBEJRZYJ SAMOUCZEK I DOŁĄCZ DO SPOŁECZNOŚCI:


(Prosimy o zamieszczanie pytań i próśb o wsparcie w komentarzach pod filmem, aby pomóc naszej społeczności rosnąć!)

🛠️ KLUCZOWE CECHY:

  • Proporcjonalne Rozmiary: Rozmiar bańki skaluje się liniowo z wielkością wolumenu.
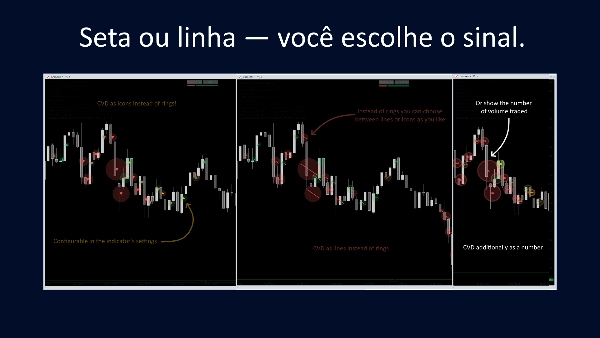
  • Podwójne Potwierdzenie: Połącz pierścień radialny i nakładkę strzałki dla głębszego kontekstu CVD.
  • Zero Konfiguracji: Automatycznie wybiera najlepszy interwał danych dla Twojego wykresu.
  • Czysty Interfejs: Konfigurowalna przezroczystość i limity wyświetlania, aby utrzymać profesjonalny wygląd wykresów.

🇧🇷 BUBBLEXRAY — O RAIO-X DE VOLUME DEFINITIVO PARA CTRADER

Identifique onde o "Smart Money" está atuando. O BubbleXRay marca picos de alto volume com bolhas proporcionais diretamente no preço. Exiba a variação acumulada do volume (CVD) integrada em um único indicador, sem sobrecarregar ou poluir seu gráfico.Chega de dúvidas: veja o rastro institucional no momento em que ele ocorre.

✅ POR QUE USAR O BUBBLEXRAY?

  • Picos de Atividade Instantâneos: As bolhas surgem assim que uma barra de alto volume fecha.
  • Rastros Institucionais: Bolhas grandes em níveis-chave revelam a atuação de grandes players.
  • Inteligência CVD: O Delta de Volume Acumulado integrado mostra se a pressão foi de Compra ou Venda.
  • Auto-Ajustável: O sistema de percentil se adapta a qualquer mercado (Tendência ou Lateralização).
  • Ancorado ao Preço: O volume é exibido no nível exato da ação, não escondido em histogramas inferiores.

📺 ASSISTA AO TUTORIAL E TIRE SUAS DÚVIDAS:


(Por favor, poste suas dúvidas e pedidos de suporte nos comentários do vídeo acima, assim ajudamos ao máximo de pessoas!)

🛠️ DESTAQUES TÉCNICOS:

  • Tamanho Proporcional: O raio da bolha escala conforme a magnitude do volume.
  • Confirmação Dupla: Use o Anel Radial e a Seta Interna para um contexto profundo de CVD.
  • Configuração Zero: Seleciona automaticamente o melhor timeframe de dados para seu gráfico.
  • Interface Limpa: Opacidade e limites de exibição configuráveis para manter seu setup profissional.


Podsumowanie

Podsumowanie AI
BubbleXRay is a volume-based trading indicator designed for the cTrader platform that visualizes institutional order flow through proportional volume bubbles directly on price charts. It highlights high-volume spikes as bubbles sized according to volume magnitude, enabling traders to identify where significant market participants are active. The indicator integrates Cumulative Volume Delta (CVD) data to distinguish buying versus selling pressure, providing deeper insight into volume dynamics without cluttering the chart. Key features include instant detection of volume spikes upon bar close, auto-scaling via a rolling percentile window adaptable to trending or ranging markets, and price-anchored volume display rather than separate histograms. Additional functionalities include dual confirmation using radial rings and overlay arrows for enhanced CVD context, zero-configuration automatic timeframe selection, and customizable opacity and display limits for a clean user interface. The indicator supports analysis of key market structure concepts such as key levels, liquidity sweeps, imbalances, supply and demand zones, and support/resistance. A preset example configuration is provided for Gold (XAUUSD) on a 1-minute chart. A tutorial video is available to assist users in setup and application. BubbleXRay requires volume and tick data and outputs visual signals directly on price charts.
Profil wskaźnika
Kategoria wskaźnika
Wolumen
Typ wyjścia
Wizualizacja
Wymagania dotyczące danych
Wolumen
Dane tickowe
Tylko słupki

Opinie klientów

4.3
Opinie: 3
5
33 %
4
67 %
3
0 %
2
0 %
1
0 %
Opinie klientów
April 25, 2026
the signal needs a real reason behind it, but one oversized trade can ruin the day.
April 20, 2026
It becomes more useful when it makes overtrading easier to notice. Size control still matters.
April 16, 2026
The first 10 trades should stay boring. Bad setups become easier to pass on, and the chart still needs a final look.

Dyskusja

Częste pytania

Key Levels
Liquidity Sweep
Imbalance
Volume
Supply & Demand
Liquidity Grab
Support & Resistance
Produkty dostępne za pośrednictwem cTrader Store, w tym boty handlowe, wskaźniki i wtyczki, dostarczane są przez deweloperów zewnętrznych i udostępniane wyłącznie w celach informacyjnych oraz w celu zapewnienia dostępu technicznego. cTrader Store nie jest brokerem i nie zapewnia doradztwa inwestycyjnego, nie udziela spersonalizowanych rekomendacji ani nie gwarantuje przyszłych wyników.

Więcej od tego autora

Wskaźnik
BOS
CHOCH
+5
Spot market structure shift with ease, overlay timeframes, avoid false breakouts with open close pivots, hide chart bars
Wskaźnik
Forex
EURUSD
+5
Fimathe Indicator - Fimathe PCM - Automated Trend Channels & Levels — Ideal for live trading and backteting
Logo „ZigXRay”
Najwyżej oceniane
4.6
(5)
$29
/
$49
Wskaźnik
CHOCH
Key Levels
+5
ZigZag Market Structure Identifier - Multi-Layer Scanner: Convergent Pivot Detection, 4-TF Overlay & Naked Chart Mode.
cBot
Fixed Lot
TP Manager
+5
Hotkeys Trading Assistant - Professional Shortcut Assitant with Risk Manager, Hotkeys & Lot Sizing.
Logo „DrbcLevels”
Najwyżej oceniane
4.0
(4)
$19
/
$29
Wskaźnik
Key Levels
Break & Retest
+5
Premium Discount Levels - Professional Dealing Range Zones with Draggable Lines, Alerts, Wartermark & Backtest Mode.
Logo „fvg_levels”
Najwyżej oceniane
4.0
(4)
$19
/
$29
Wskaźnik
Key Levels
Order Block
+5
FVG Levels — Auto-Detection of Multi-Timeframe Fair Value Gaps & GAPs, Smart Filters and Liquidity Zone Monitoring
Wtyczka desktopowa
Risk/Reward
Trade Journal
+5
cTrader Journal - Automatic Trade Capture. Offline Reviews. No Subscription.
Wskaźnik
CHOCH
Inducement
+5
TradeLens - Frame the Trade. Refine the Entry. Two Timeframes. One Decision.

Możesz także polubić

Wskaźnik
Laguerre RSI: smoother, faster RSI with less noise. Great for spotting reversals and timing entries.
Wskaźnik
MACD
Key Levels
+2
Trend indicator with multi-timeframe filters, generating signals only on fully completed bricks & candles. No Repaint.
Wskaźnik
The long awaited new and improved Supply Demand Premium V2 indicator. Unlock greater trading opportunities now!
Wskaźnik
ATR
RSI
+19
Multi-timeframe heatmap scoring Direction, Strength & Volatility at a glance!
Wskaźnik
Forex
EURUSD
+4
Check the correlations between dozens of assets in one elegant display.
Wskaźnik
SMC
Prop
+15
Previous HLOC – Smart Higher-Timeframe Levels for Precision Trading.
Wskaźnik
Crypto
Signal
+3
Candlestick Signal Finder: cTrader indicator that automatically detects and color-codes key Japanese candlestick pattern
Wskaźnik
Volume
Custom range volume profile between two draggable anchors. Auto source timeframe, Total/Up-Down/Delta, POC, Value Area.
Wskaźnik
Forex
BTCUSD
+11
Unlock trading precision with QQE! Dual QQE indicators with a Bollinger Bands zero line provide clear buy/sell signals.
Wskaźnik
ADX
ATR
+1
Indicador de Sinais Visuais para Spotcrude (WTI) ou SpotBrent com filtros de tendência, operacional de 10 e 15 minutos.
Wskaźnik
ATR
RSI
+7
Identify bullish and bearish Order Blocks to spot key support/resistance levels and potential trend reversals! 📈🔄
Wskaźnik
Prop
Forex
+11
🌊 See when the market is truly in play. Tsunami measures Relative Volume by time-of-day 🌊
Wskaźnik
AI
SMC
+19
ZigZag Pro — Advanced swing detection with ATR threshold, fractal confirmation, and colored segments. Clean market
Wskaźnik
EMA
RSI
+4
🚀📈 Plot buy/sell signals on Range Bars using Moving Averages and RSI. Clear, actionable trading insights.🚀📈
Wskaźnik
AI
ATR
+27
Deep Mood Distribution (DMD) is a segmented volume-profile and sentiment tool that analyzes price action in fixed bar bl
Wskaźnik
Prop
Forex
+13
VIX Pro: Volatility Index Tool with ATR-Based Breakout Alerts
Wskaźnik
RSI
Stochastic
+2
Composite mean-reversion oscillator merging Z-Score, RSI & Bollinger %B into one clear overbought/oversold signal.
Wskaźnik
BOS
MSS
+5
Your entire ICT session map, structure engine, and key levels — No manual work. One indicator. Every session!

Cena

Od 09/02/2026
23
Sprzedaż
160
Bezpłatne instalacje