present
Daftar dan dapatkan potongan bernilai $50 untuk pembelian pertama anda
Trading product for Impulse Heatmap Indikator EMA Key Levels, image 1
Impulse Heatmap
Indikator
Versi 1.0, Aug 2026
Windows, Mac
Trading product for Impulse Heatmap Indikator EMA Key Levels, image 2
Trading product for Impulse Heatmap Indikator EMA Key Levels, image 3
Trading product for Impulse Heatmap Indikator EMA Key Levels, image 4
Trading product for Impulse Heatmap Indikator EMA Key Levels, image 5
Sejak 07/05/2026
6
Jualan
63
Pemasangan percuma

Penerangan

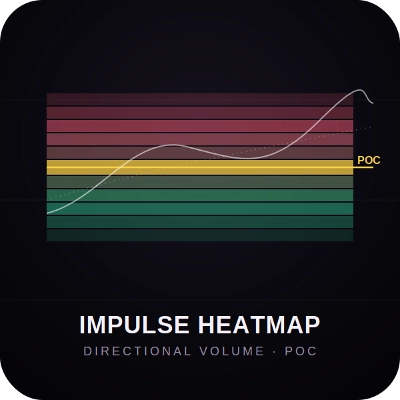
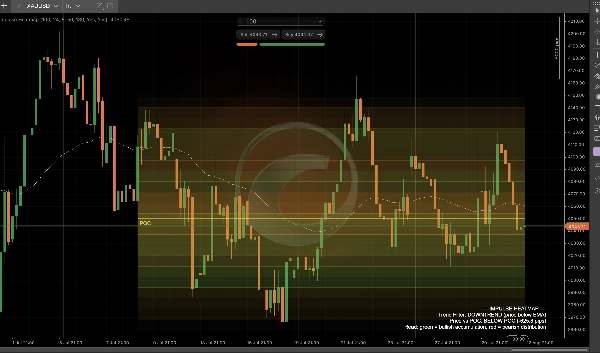
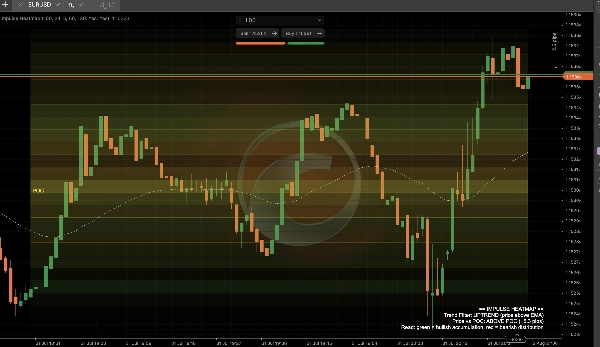
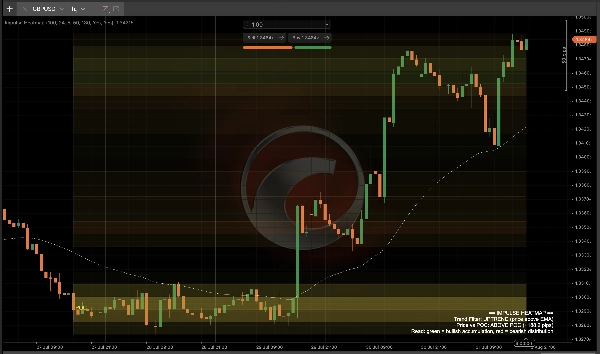
Peta haba volum kini ada di mana-mana, tetapi hampir kesemuanya menunjukkan perkara yang sama: hanya intensiti, satu warna, tiada rasa sama ada volum itu adalah pembelian atau penjualan. Impulse Heatmap menambah bahagian yang hilang — setiap zon harga diwarnakan dengan campuran warna mengikut arah, bukan hanya ketumpatan, supaya anda boleh membezakan pengumpulan daripada pengedaran dengan mudah.

Apa yang dianalisis: jumlah volum tick merentasi tetingkap tinjauan bergulung, diagihkan ke dalam bin harga dengan cara yang sama seperti profil volum standard berfungsi — kecuali warna setiap bin adalah campuran berapa banyak volum itu datang dari lilin penutupan bullish berbanding lilin penutupan bearish pada harga tersebut. Zon yang kebanyakannya volum bullish bersinar hijau (pengumpulan); zon yang kebanyakannya volum bearish bersinar merah (pengedaran); zon campuran berada di antara kedua-duanya.

Cara membacanya:

  • Zon cerah dan tepu = kepekatan volum tinggi — ini adalah tahap harga di mana pasaran telah menghabiskan masa dan saiz paling banyak.
  • Zon berwarna hijau = tahap harga itu dibina kebanyakannya atas tekanan bullish — kawasan sokongan/pengumpulan yang berpotensi.
  • Zon berwarna merah = tahap harga itu dibina kebanyakannya atas tekanan bearish — kawasan rintangan/pengedaran yang berpotensi.
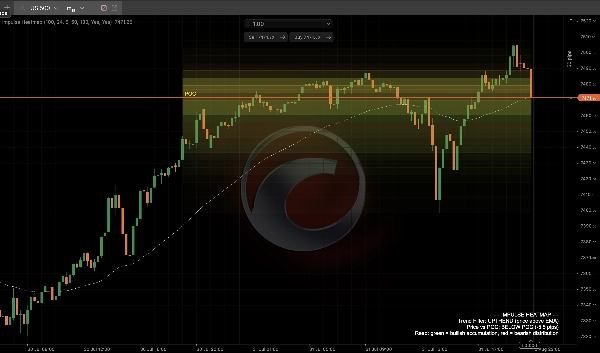
  • Garis POC emas menjejaki pusat graviti volum yang dilicinkan — di mana "nilai adil" sebenar kini berada, tanpa lonjakan pengiraan titik kawalan mentah.
  • Penapis trend EMA putih memberi anda konteks: adakah zon haba semasa menyokong trend yang sedang berlaku, atau melawannya?
  • Panel HUD langsung memberitahu anda keadaan trend dan sejauh mana harga dari POC dalam pip.

Tetapan utama: panjang tetingkap tinjauan, bilangan bin harga (resolusi), pelicinan POC, tempoh penapis trend EMA, dan penyesuaian warna penuh untuk campuran bullish/bearish dan garis POC.

Kegunaan biasa: mengesan sama ada zon sokongan/rintangan dibina atas tekanan pembelian atau penjualan yang sebenar dan bukan hanya volum mentah; menggunakan POC sebagai magnet nilai adil dinamik; mengesahkan sama ada volum pada tahap semasa bersetuju atau bertentangan dengan trend yang sedang berlaku; digabungkan dengan model kemasukan anda sendiri sebagai penapis konteks volum.

Sesuai untuk: pedagang intrahari pada forex utama, emas, dan indeks yang mahukan lebih daripada bar volum rata atau peta haba satu warna — berguna sebagai bacaan berdiri sendiri atau sebagai konfluens bersama setup berasaskan struktur.

Ringkasan

Ringkasan AI
Impulse Heatmap is a directional volume heatmap indicator designed to analyze tick volume distribution across price zones with a focus on volume direction—buying versus selling—rather than just volume intensity. It segments volume into price bins similar to a volume profile but colors each bin based on the proportion of bullish-closing versus bearish-closing candle volume. Zones with predominantly bullish volume appear green, indicating accumulation or potential support, while zones with mostly bearish volume appear red, indicating distribution or potential resistance. Mixed zones show blended colors.

Key features include:
- Bright, saturated zones highlighting high volume concentration price levels.
- A gold Point of Control (POC) line representing a smoothed volume center of gravity as a dynamic fair value reference.
- A white trend filter EMA providing context on whether volume zones align with or oppose the prevailing trend.
- A live HUD panel displaying trend state and price distance from the POC in pips.
- Customizable settings for lookback window, price bin resolution, POC smoothing, trend filter EMA period, and color schemes.

Impulse Heatmap is suited for intraday traders focusing on forex majors, gold, and indices who require enhanced volume context to distinguish genuine buying or selling pressure at key support and resistance levels. It can be used standalone or combined with other structural or entry models.
Profil indikator
Kategori indikator
Trend
Jenis output
Isyarat
Visualisasi
Keperluan data
Bar sahaja
Data tick
Isyarat yang disokong
Terobosan
Pembalikan
Kekuatan trend
Kemeruapan
Julat pembukaan sesi
Capahan

Perbincangan

Ulasan pelanggan

0.0
Ulasan: 0
Ulasan pelanggan
Belum ada ulasan untuk produk ini. Anda sudah mencuba produk tersebut? Jadilah yang pertama untuk berkongsi pendapat anda!

Soalan Lazim

EMA
Key Levels
AI-assisted
BOS
Volume
Market Structure
Support & Resistance
Produk yang tersedia melalui cTrader Store, termasuk bot dagangan, indikator dan plugin, disediakan oleh pembangun pihak ketiga dan diberikan akses untuk tujuan maklumat dan teknikal sahaja. cTrader Store bukan broker dan tidak memberikan nasihat pelaburan, syor peribadi atau sebarang jaminan prestasi masa hadapan.

Lebih banyak produk daripada penulis ini
Indikator
ATR
BOS
+5
Full ICT/SMC 4-step setup checker that alerts a long or short setup.
Indikator
BOS
CHOCH
+5
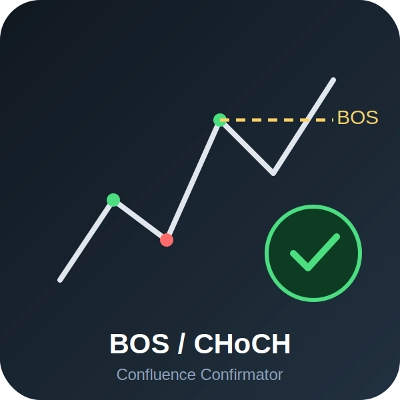
BOS/CHoCH signals confirmed by liquidity sweep + FVG confluence, with a live conviction score.
Indikator
AI-assisted
Order Block
+5
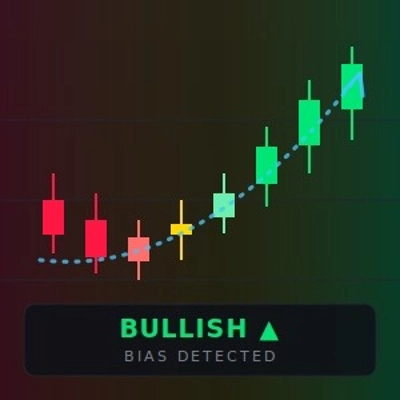
The daily bias estimator indicator uses ICT concepts to show whether the chart is bullish or bearish on multi-time frame
Indikator
MSS
AI-assisted
+5
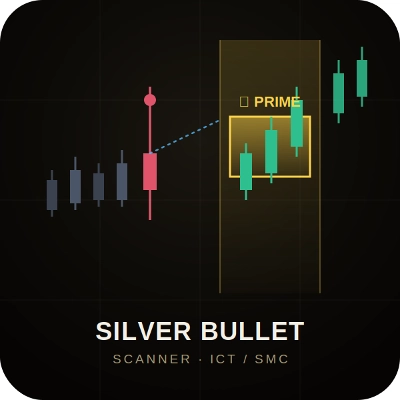
Live ICT Silver Bullet detection: liquidity sweeps, structure shifts, and killzone-gated FVGs, graded and glowing in rea
Indikator
ATR
Key Levels
+5
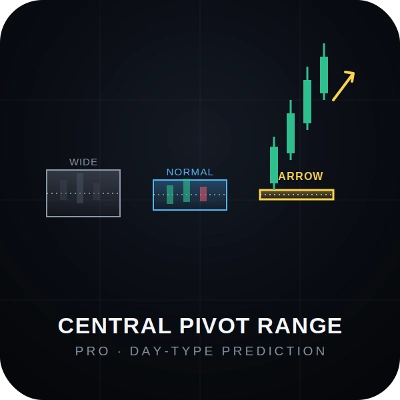
CPR indicator that actually predicts the day ahead: width percentile scoring for breakout-day detection
Indikator
Triangle
Double Top
+5
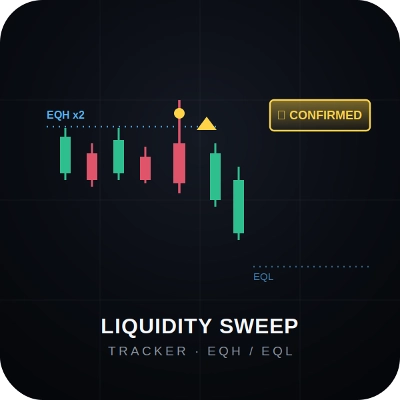
Know which liquidity sweeps are real. Auto-tracks EQH/EQL and confirms genuine reversals, not just broken levels.
Indikator
ATR
MSS
+5
Grades ICT Unicorn setups (Breaker Block + FVG confluence) into PRIME / SETUP / WATCH, with retest & RR targets.
Indikator
BOS
Volume
+5
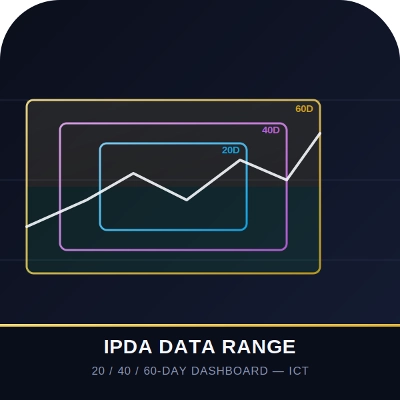
20/40/60-day IPDA lookback ranges, Premium/Discount/Equilibrium zones, and quarterly shift alerts — anchored to true dai
Indikator
BOS
MSS
+5
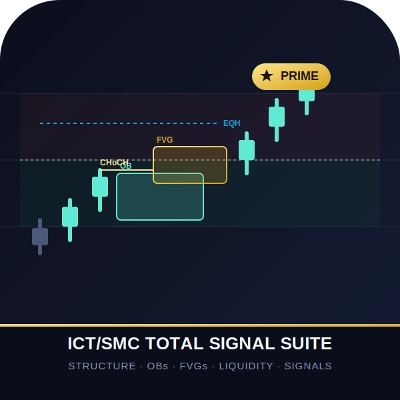
One indicator, full ICT/SMC picture — structure, OBs, FVGs, liquidity, Premium/Discount — with graded PRIME/SETUP signal
Indikator
ATR
Volume
+5
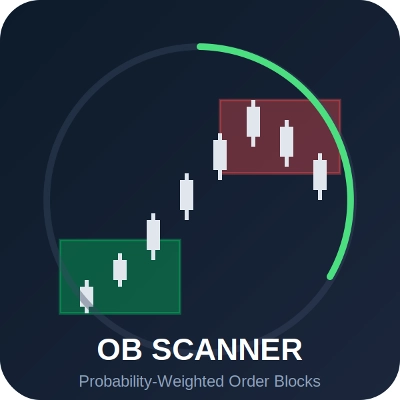
Order blocks with measured hold-rate stats and confidence scoring — not just zones on a chart.
Indikator
Volume
Channel
+5
Spots volatility squeezes before they fire — the compression phase everyone else misses.
Indikator
Volume
Fibonacci
+5
Classic 9:30 Opening Range Breakout — auto-plots the range, flags volume-confirmed breakouts long or short, live.

Anda juga mungkin suka

Indikator
ATR
BOS
+5
Opening ranges, dynamic trend channels, and multi-scale breakout/retest analysis for clear intraday chart decisions.
Indikator
Smart Liquidity Zones PRO auto-detects liquidity grabs, wicks, traps & manipulations — trade like the smart money.
Indikator
ATR
BTCUSD
+5
Trailing algo 📈 auto-tracks trends 🎯 adapts to volatility 🌟 precise moves 🛡️ retest signals 🚀 no lag, smart market
Indikator
ATR
Wedge
+2
Strong Supertrend Turn Market Movement into a Clear Map Market analysis
Indikator
ATR
The Tenkan-ATR Indicator is a powerful and innovative indicator for Traders. SALE OFF!!!
Indikator
ZigZag Pro – Multi-Swing Indicator for cTrader Description: ZigZag Pro is a powerful and fully customizable swing indica
Indikator
RSI
Forex
+6
🚀 QQEX Trinity Indicator - The Ultimate Trading Filter 🚀
Indikator
RSI
RSI on the main chart with 45/55 momentum levels, overbought/oversold levels, averaged RSI, and multi-timeframe support.
Indikator
ATR
RSI
+1
Super Trend Rsi ,ATR + trend change distance + dynamic Alpha, divergence/convergence
Indikator
Prop
Forex
+13
Unlock trading precision with QQE! Dual QQE indicators with a Bollinger Bands zero line provide clear buy/sell signals.
Indikator
AI
ATR
+20
Algorithmic trend precision for cTrader.
Indikator
MACD
Crypto
A simple tool to control market sessions. fixed the display on the weekend.
Indikator
It draws a step line that visualize the movement of H4. Particularly effective when trade on lower timeframe.
Indikator
RSI
EURUSD
+2
It identifies areas of market imbalance (Fair Value Gaps or FVGs) and projects them on the chart in a smart way
Indikator
Imbalance
Fair Value Gap
+1
Multi-symbol, multi-timeframe Fair Value Gaps in one panel.
Indikator
MACD
Prop
+14
Customize the MACD! Choose colors, get real-time tick updates, and see crossover points for enhanced trading precision.
Indikator
Forex
BTCUSD
+8
The traditional Hull Moving Average with different colours based on the slope (direction) of the trend.
Indikator
Smoothed CCI alerts! Audio & arrow signals for +/-100 crosses. Custom sounds & arrow filters. Precision trading!

Harga

Sejak 07/05/2026
6
Jualan
63
Pemasangan percuma