
Descripción
ZigzagSR – Oscilaciones Zigzag Dinámicas con Soporte y Resistencia Automatizados
Descubra una estructura de mercado más clara y zonas de entrada precisas con ZigzagSR, un potente indicador de cTrader que:
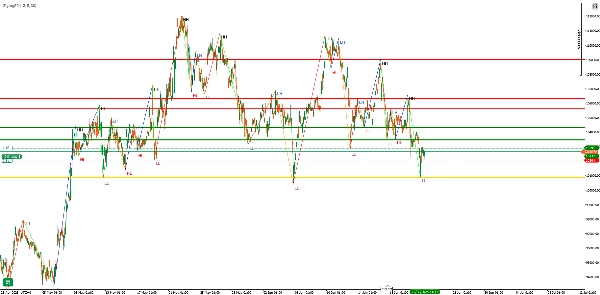
- Traza oscilaciones zigzag que no se repintan (máximos más altos, máximos más bajos, mínimos más altos, mínimos más bajos) en tiempo real
- Dibuja automáticamente niveles dinámicos de soporte y resistencia basados en las oscilaciones pivote más recientes
- Etiqueta cada punto de oscilación (“HH”, “LH”, “HL”, “LL”) para una claridad inmediata de la tendencia
Características Clave
- Detección Adaptativa de Zigzag
-
- Parámetros configurables Depth, Deviation y Backstep para ajustar la sensibilidad al ruido del mercado
- La lógica que no repinta asegura que las señales históricas permanezcan estables una vez dibujadas
- Niveles SR Automáticos
-
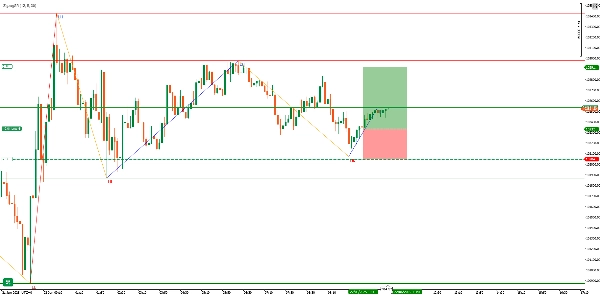
- Dibuja una línea Pivot en el último punto de oscilación válido (línea dorada)
- Resalta hasta los últimos tres máximos de Resistance (líneas rojas) y tres mínimos de Support (líneas verdes) antes del pivote
- Las líneas se actualizan sin problemas a medida que se forman nuevas oscilaciones, manteniendo tu gráfico ordenado
- Etiquetas Visuales Claras
-
- “HH” (Máximo Más Alto) y “LH” (Máximo Más Bajo) para picos bajistas/más altos
- “HL” (Mínimo Más Alto) y “LL” (Mínimo Más Bajo) para valles alcistas/más bajos
- Segmentos zigzag codificados por colores:
-
- HH → Lima
- LH → Naranja
- HL → Azul
- LL → Rojo
Entradas y Personalización
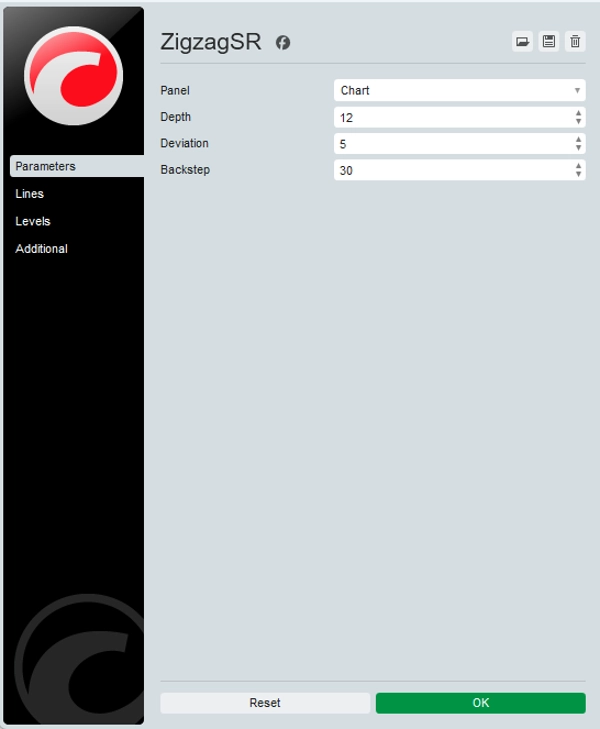
ParámetroPredeterminadoDescripción
Depth
12
Barras hacia atrás para identificar máximos/mínimos locales
Deviation
5
Movimiento mínimo de precio (en ticks) para contar como una oscilación
Backstep
3
Barras para “rebobinar” y suprimir pivotes falsos
Consejo: Aumenta Depth y Deviation en marcos temporales mayores para filtrar el ruido; redúcelos en M1/M5 para mayor sensibilidad.
¿Por qué usar ZigzagSR?
- Confirmación de Tendencia: Distingue claramente oscilaciones impulsivas de movimientos correctivos—ideal para traders de swing y rupturas.
- Zonas de Entrada SR: Los niveles marcados automáticamente te ayudan a identificar zonas de entrada, stop-loss y take-profit sin dibujar líneas manualmente.
- Desarrollo de Estrategias: Las etiquetas y líneas alimentan directamente EAs/cBots o sistemas manuales—construye configuraciones consistentes basadas en reglas.
Cómo Funciona
- Mapeo de Máximos/Mínimos
-
- Escanea barras durante los últimos
Depthperíodos para señalar extremos locales (_highMapy_lowMap).
- Escanea barras durante los últimos
- Construcción de Oscilaciones
-
- Alterna entre estados alcistas y bajistas, añadiendo solo pivotes significativos a la lista de oscilaciones.
- Asignación de Etiquetas
-
- Compara cada pivote con el anterior para etiquetarlo como HH/LH o HL/LL.
- Dibujo de SR
-
- Identifica el pivote más reciente como la “línea pivote”, luego traza los tres máximos y mínimos válidos precedentes como resistencia/soporte.
- Renderizado Zigzag
-
- Conecta todos los puntos de oscilación con líneas de tendencia coloreadas y superpone etiquetas de texto ligeramente desplazadas para mayor claridad.
Casos de Uso y Consejos
- Swing Trading: Aprovecha impulsos de múltiples barras—entra en retrocesos hacia la línea pivote, apunta al siguiente nivel SR.
- Confirmación de Ruptura: Espera a que el precio atraviese una línea de resistencia dibujada por ZigzagSR, luego confirma con volumen o RSI.
- Superposición con Otros Indicadores: Combina con medias móviles, divergencias RSI o perfiles de volumen para fortalecer las señales.
Comienza en segundos:
- Instala ZigzagSR desde la tienda cTrader.
- Colócalo en cualquier gráfico—no se requieren bibliotecas externas.
- Ajusta los tres parámetros de entrada según tu marco temporal y estilo de estrategia preferidos.
Eleva tu análisis de gráficos con estructura de oscilaciones en tiempo real y soporte y resistencia dinámicos—prueba ZigzagSR hoy mismo!
Resumen
Valoraciones de clientes
5 | 33 % | |
4 | 67 % | |
3 | 0 % | |
2 | 0 % | |
1 | 0 % |


