
DailyMA
Indicador
1 compras
Versión 1.0, Nov 2025
Windows, Mac
5.0
Valoraciones: 1
Descripción
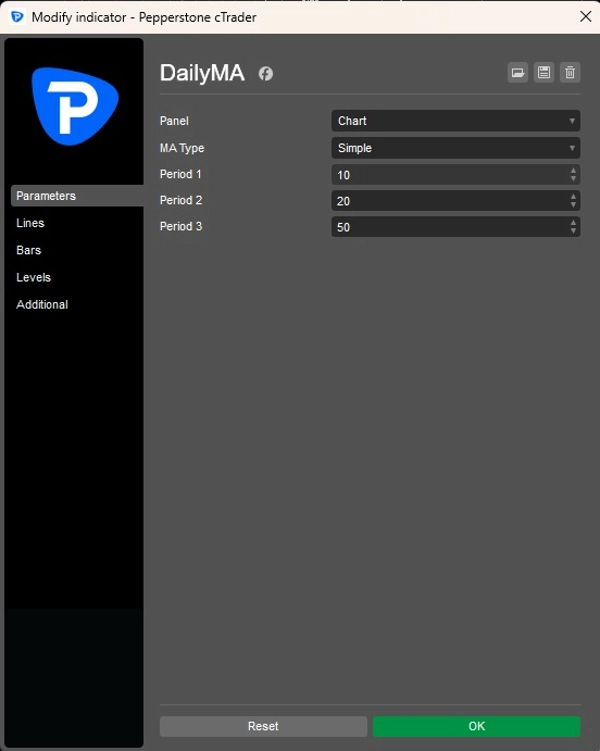
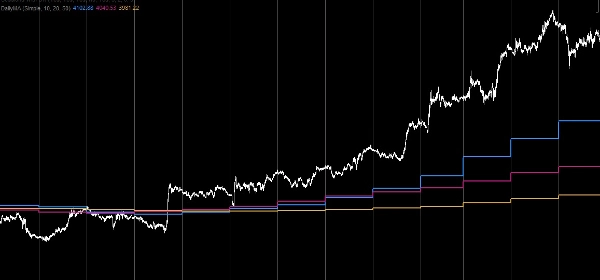
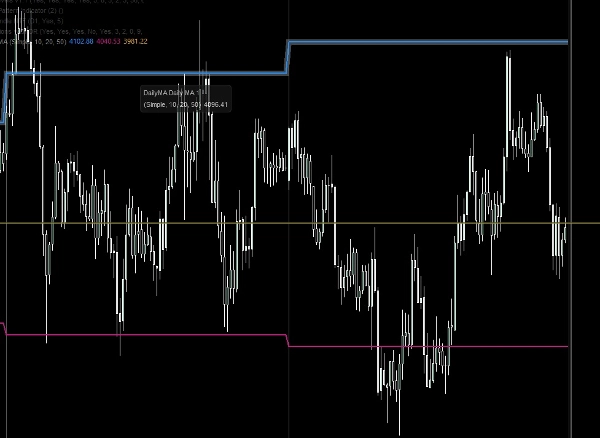
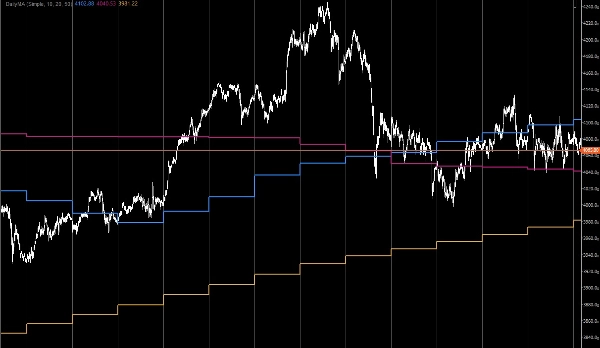
El Indicador de Media Móvil Diaria está diseñado para traders que desean superponer la estructura de un marco temporal superior en sus gráficos intradía. Calcula y muestra hasta tres medias móviles diarias directamente en gráficos de marcos temporales más pequeños, ofreciéndote una vista clara de la dinámica de la tendencia diaria mientras operas en intervalos inferiores.
Características clave:
- Tres medias móviles diarias trazadas simultáneamente para un análisis de tendencia mejorado
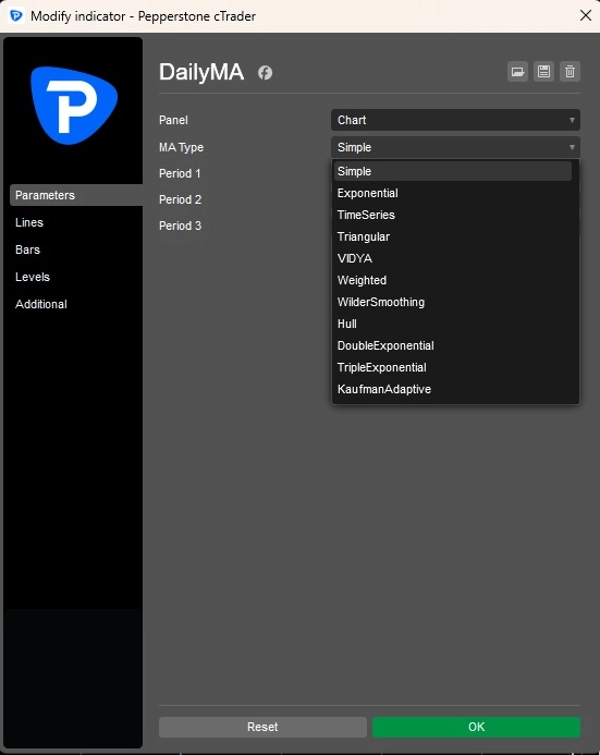
- Tipo de media móvil seleccionable (SMA, EMA, WMA, etc.) para cada línea
- Cálculo diario automático independientemente del marco temporal del gráfico
- Diseño minimalista — colores y estilos fijos para consistencia y claridad
Este indicador es ideal para traders que dependen de niveles diarios para guiar decisiones intradía, ofreciendo una forma simple pero poderosa de mantener visible el contexto de marcos temporales superiores sin desorden ni personalización innecesaria.
Resumen
Perfil del indicador
Valoraciones de clientes
5.0
Valoraciones: 1
5 | 100 % | |
4 | 0 % | |
3 | 0 % | |
2 | 0 % | |
1 | 0 % |
Conversación
Preguntas frecuentes
Signal
Indices
Commodities
GBPUSD
RSI
Bollinger
Fibonacci
Scalping
XAUUSD
NAS100
MACD
BTCUSD
Forex
Breakout
EURUSD
NZDUSD
Prop
ZigZag
Supertrend
Fair Value Gap
SMC
Crypto
Stocks
ATR
USDJPY
VWAP
Los productos disponibles a través de cTrader Store, incluidos bots, indicadores y plugins para operar, son proporcionados por desarrolladores de terceros y están disponibles únicamente con fines informativos y de acceso técnico. cTrader Store no es un bróker, por lo que no proporciona asesoramiento de inversión, recomendaciones personales ni ninguna garantía de rentabilidad futura.
Más de este autor


Precio
Desde 24/04/2025
161.83M
Volumen operado
17.59K
Pips ganados
11
Ventas
328
Instalaciones gratis