
Descripción
Dinámica Avanzada de Tendencias con Bandas de Bollinger en el Oscilador
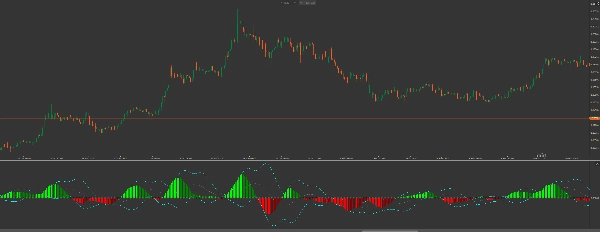
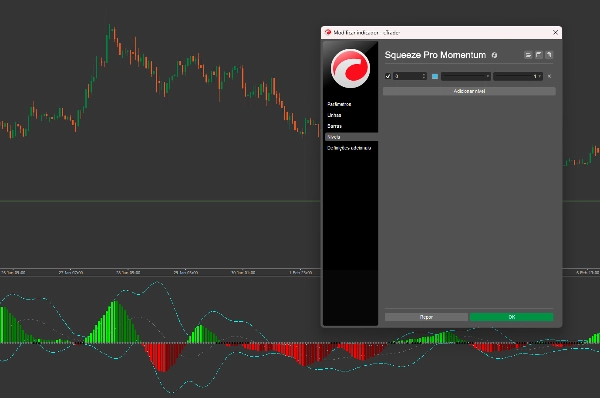
El Squeeze Pro: Momentum & Volatility Suite es un conjunto de herramientas de nivel institucional para cTrader. A diferencia de los indicadores estándar, esta suite proporciona un análisis de doble capa del comportamiento del mercado: identifica la Fase de Squeeze (compresión del mercado) y monitorea los Extremos de Momentum usando Bandas de Bollinger calculadas directamente sobre el oscilador.
Innovaciones Clave
-
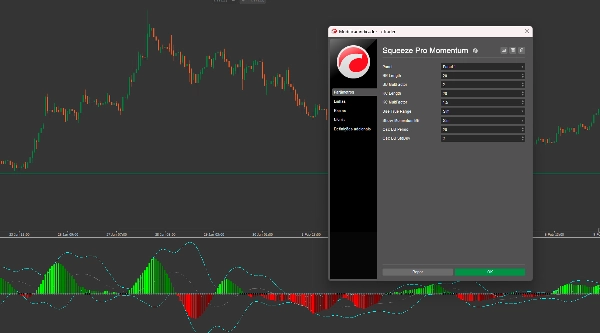
- Bandas de Bollinger de Momentum: Las primeras de su tipo. Al aplicar las BB al histograma de momentum, puedes identificar niveles de momentum "sobrecomprado" o "sobrevendido", perfecto para cronometrar salidas antes de que la tendencia se agote.
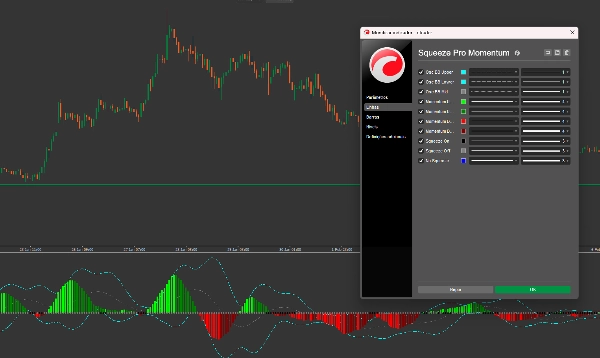
- Detección de Squeeze en Tres Estados:
-
- Puntos Negros (Squeeze Activado): Alta compresión. El mercado está "enroscándose" para una ruptura masiva.
- Puntos Grises (Squeeze Desactivado): La volatilidad se está expandiendo. El movimiento ha comenzado.
- Puntos Azules (Sin Squeeze): Condiciones normales del mercado.
- Suavizado por Regresión Lineal: Utiliza un algoritmo refinado
CalculateLinearRegressionpara filtrar el ruido del precio, proporcionando un histograma suave y confiable. - Lógica de Superposición Dual: Opera en una ventana de indicador separada para mantener limpio tu gráfico de precios mientras proporciona profundos conocimientos analíticos.
Guía de Inteligencia Visual:
-
- El Histograma (Tendencia y Fuerza)
-
- Lima: El momentum alcista está acelerando (Fuerte compra).
- Verde: El momentum alcista está desacelerando (Toma de ganancias).
- Rojo: El momentum bajista está acelerando (Fuerte venta).
- Granate: El momentum bajista está desacelerando (Vendedores agotados).
- Las Bandas del Oscilador (Las líneas "Cian")
-
- Cuando las barras del histograma se empujan fuera de las Bandas de Bollinger Cian, la tendencia actual está en un extremo estadístico. Busca reversiones o retrocesos importantes cuando el histograma comience a retroceder dentro de estas bandas.
Estrategia de Trading: La "Ruptura Poderosa"
-
- Identifica el Squeeze: Espera a que aparezcan Puntos Negros en la línea cero. Esto indica la "calma antes de la tormenta."
- Confirma la Dirección: Busca la primera barra del histograma Lima (Compra) o Roja (Venta).
- El Disparador: Entra en la operación cuando aparezca el Squeeze Desactivado (punto gris), señalando la liberación de energía.
- La Salida: Toma ganancias cuando el histograma cambie de Lima a Verde, O cuando el histograma alcance la Banda Superior del Oscilador, señalando agotamiento.
¿Por qué Actualizar a Squeeze Pro?
Mientras que los indicadores básicos te muestran dónde fue el precio, Squeeze Pro te muestra la presión detrás del movimiento. Al ver el squeeze y las bandas de momentum simultáneamente, evitas entrar en tendencias que ya están agotadas y capturas los movimientos explosivos que otros pierden.
Nota del Desarrollador: Este indicador está altamente optimizado para la API de cTrader, asegurando cero retrasos en el rendimiento incluso en máquinas de gama baja mientras maneja cálculos complejos de regresión lineal en tiempo real.
Resumen
Key features include linear regression smoothing to reduce price noise, a dual-overlay display that keeps the price chart uncluttered, and a color-coded histogram that visually represents bullish and bearish momentum strength and changes. When histogram bars move outside the oscillator’s Bollinger Bands (cyan lines), it signals statistically extreme momentum levels, useful for timing entries and exits.
The indicator supports a "Power Breakout" trading strategy: traders wait for squeeze signals, confirm momentum direction via histogram colors, enter trades on squeeze release, and exit when momentum shows signs of exhaustion. This suite provides institutional-grade insights into trend pressure and momentum dynamics, helping traders identify potential explosive moves and avoid exhausted trends.
Valoraciones de clientes
5 | 0 % | |
4 | 100 % | |
3 | 0 % | |
2 | 0 % | |
1 | 0 % |


![Logotipo de "[Hamster-Coder] Bollinger Bands"](https://cdn.ctrader.com/image/webp/21d8e5d6-fb11-4bac-b9ee-cd05c2b76804_30327)


