
説明
Volume Profile Proは、cTrader用の非常にカスタマイズ可能で軽量なボリュームプロファイルインジケーターで、コントロールポイント(POC)、バリューエリアハイ(VAH)、バリューエリアロー(VAL)など、多くの設定を好みに合わせて調整できます。
機能概要
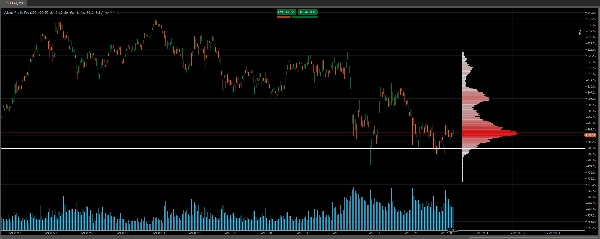
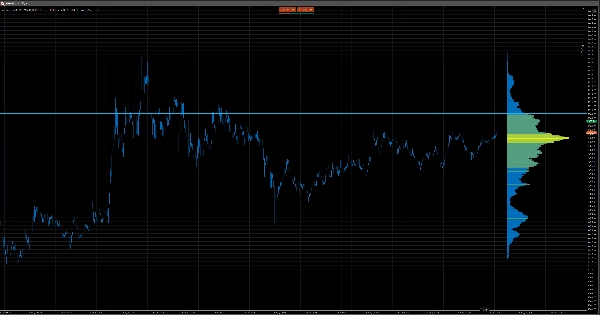
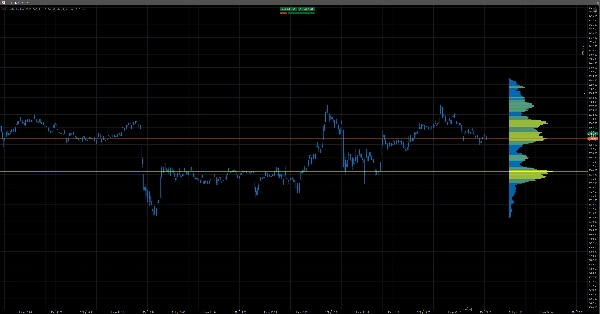
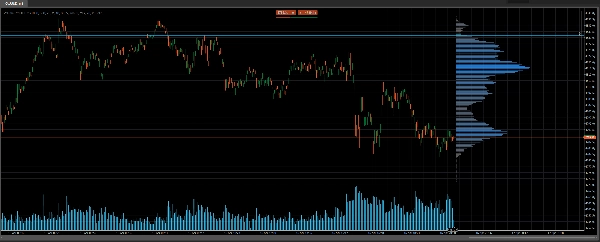
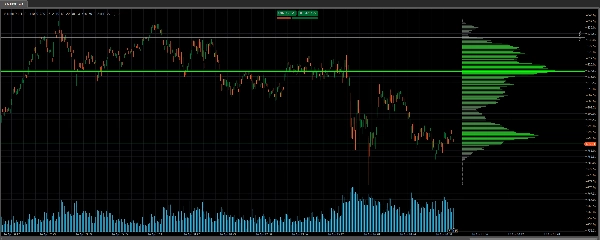
Volume Profile Proは、設定可能な遡及期間にわたって各価格レベルで取引されたボリュームを示す水平ヒストグラムをcTraderチャートに直接描画します。時間に対するボリュームを測定するのではなく、価格別にボリュームを測定し、市場で最も取引が行われた場所を即座に明らかにします。これにより、自動的に3つの重要なレベルを計算し描画します:コントロールポイント(POC)、最も取引量の多い価格;およびバリューエリアハイ(VAH)とバリューエリアロー(VAL)、全取引量の70%(設定可能)を含む価格範囲の境界です。
動作原理
インジケーターはユーザーが定義した過去のバー数をスキャンし、高値から安値までの価格範囲を見つけ、それを均等に分割した価格行に分割します。各バーのティックボリュームは、その範囲にまたがるすべての価格行に分配されます。その結果、ボリュームに比例したバー幅と低ボリュームから高ボリュームへのグラデーションカラースキームを持つ価格別ボリュームヒストグラムが生成されます。標準的なバー単位のOHLCVデータのみで動作し、ティックフィードやDOM、外部データソースは不要で、最後のバーのみ再計算するため、高速で軽量かつ非妨害的です。
高度なカスタマイズ性
ほぼすべての視覚的および分析的要素が調整可能です:遡及期間、価格行数、プロファイル幅、行の厚さ、不透明度、グラデーションカラースキーム、POCの色と厚さ、バリューエリアのパーセンテージ閾値、VAラインのスタイルなど。これにより、控えめな背景参照レイヤーとしても、強力な単独分析ツールとしても同様に使用できます。
対象ユーザー
- 軽量なボリュームプロファイルインジケーターを求めるトレーダー
- クリーンな見た目のボリュームプロファイルを求めるトレーダー
- チャート上で遡及期間を自分で設定したいトレーダー
- 多くの色や不透明度を設定できる機能を求めるトレーダー
- チャート上の幅や配置を調整したいトレーダー
- 価格行数を設定したいトレーダー(400未満に保つことを推奨)
- コントロールポイント(POC)、バリューエリアハイ(VAH)、バリューエリアロー(VAL)のラインをオン・オフし、外観を調整したいトレーダー
これを当社のLevel 2 DOM Volume Delta Proインジケーターと組み合わせることで、重要なレベルでより良い情報に基づく意思決定が可能になります: https://ctrader.com/products/4138
当社の素晴らしいBlack Box Botはこちら: https://ctrader.com/products/3241
概要
The tool analyzes historical bar data by dividing the high-to-low price range into evenly spaced rows and distributing each bar’s tick volume across these rows. This creates a volume-at-price histogram with adjustable bar widths proportional to volume and a gradient color scheme indicating volume intensity. It operates solely on standard OHLCV bar data without requiring tick feeds or external sources, recalculating only on the latest bar to maintain performance.
Users can extensively customize visual and analytical settings, including lookback period, number of price rows, profile width, opacity, colors, and the appearance and visibility of POC, VAH, and VAL lines. This flexibility allows the indicator to serve as either a subtle background reference or a prominent analytical tool. It supports analysis of key market structure concepts such as supply and demand, support and resistance, and liquidity zones.
カスタマーレビュー
5 | 0 % | |
4 | 100 % | |
3 | 0 % | |
2 | 0 % | |
1 | 0 % |


![「High-Low Divergence [Iridio Capital]」ロゴ](https://cdn.ctrader.com/image/webp/443c4661-7abb-40f1-842f-4b6ec560649b_40914)


