
Frac Support Resistance V1
インジケーター
2 購入済
バージョン 1.0、Nov 2025
Windows、Mac
5.0
レビュー: 1
説明
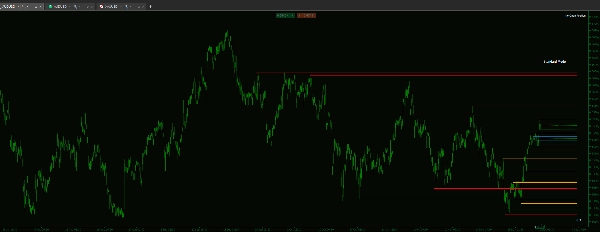
もしマーケット構造に基づいて取引するなら、最も重要なレベルはしばしばより高い時間軸で設定されることを知っています。このカスタムインジケーターは、それらのレベルを手動で特定し追跡する際のフラストレーションを解消します。
このツールは信頼できる視覚的階層を提供するよう設計されており、重要な構造的境界を確認し、実行画面を離れることなく高価値ゾーンを優先できるようにします。
主な特徴と詳細なコントロール
- インジケーターは卓越したパフォーマンスとクリーンなチャート表示のために構築されています:
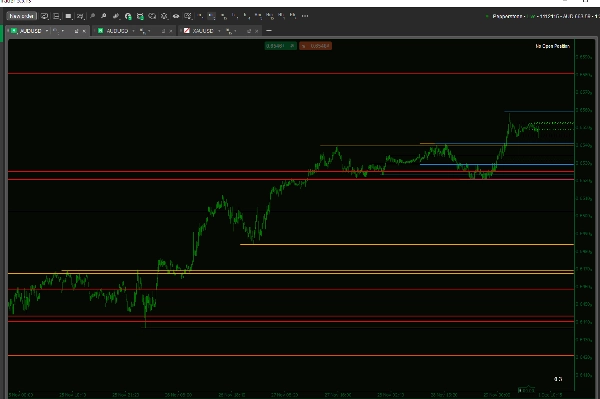
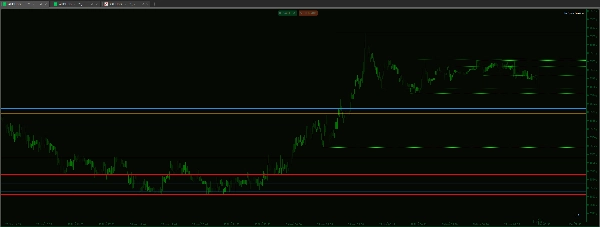
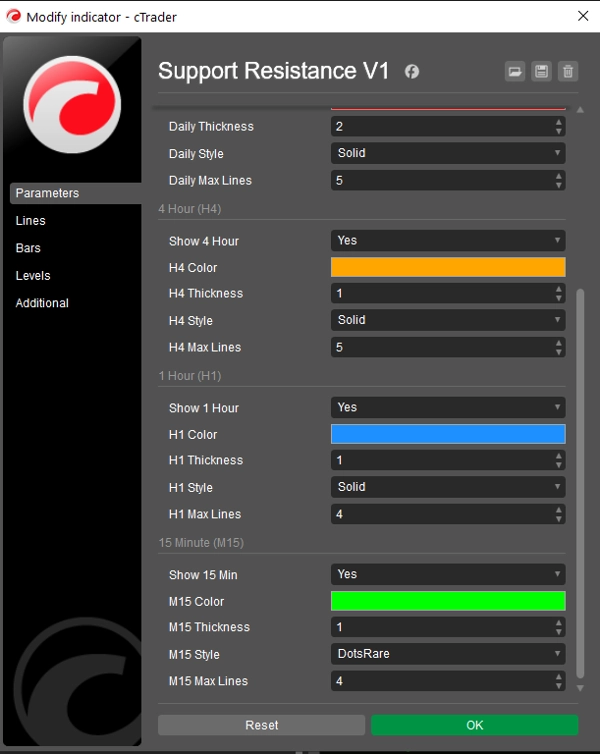
- 真の視覚的階層:各時間軸ごとに線の太さ、スタイル(実線、破線、点線)、色を独立して制御できます。
- 利点:レベルの強さを見た目だけで即座に認識できます(例:主要構造にはD1ラインを太く実線に、即時レベルにはH1ラインを細く点線に設定)。
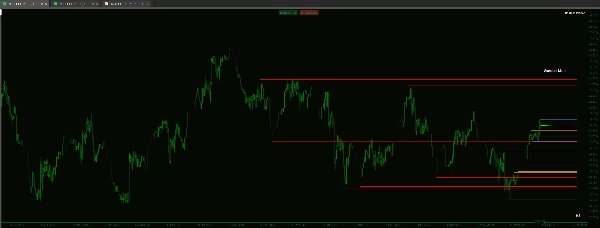
- パフォーマンスとフォーカスの制御:散らかったチャートにうんざりしていますか?各時間軸ごとに表示する最大ライン数を個別に制限できます。
- 例:H4の最大ライン数を5に、D1の最大ライン数を15に設定して、低時間軸の最近のレベルを優先しつつ、主要構造の深いビューを維持します。
- クリーンなコード基盤:信頼できるフラクタルロジックに基づいて構築されており、特定されたレベルは標準的な構造分析で使用される本物の高値/安値のピボットです。
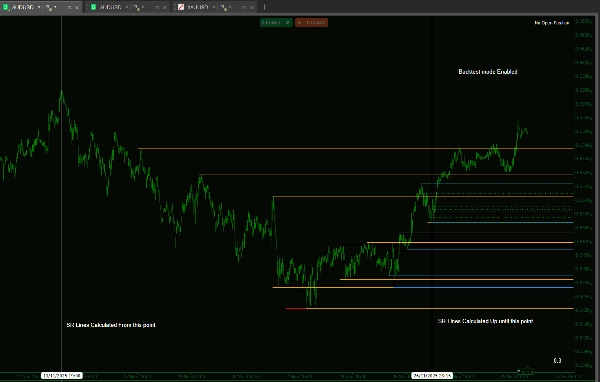
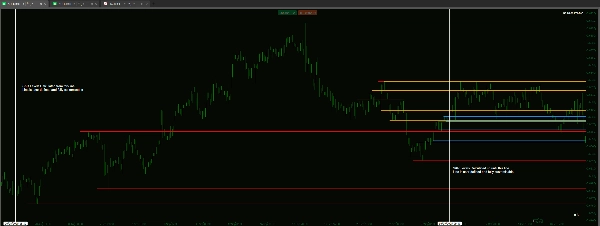
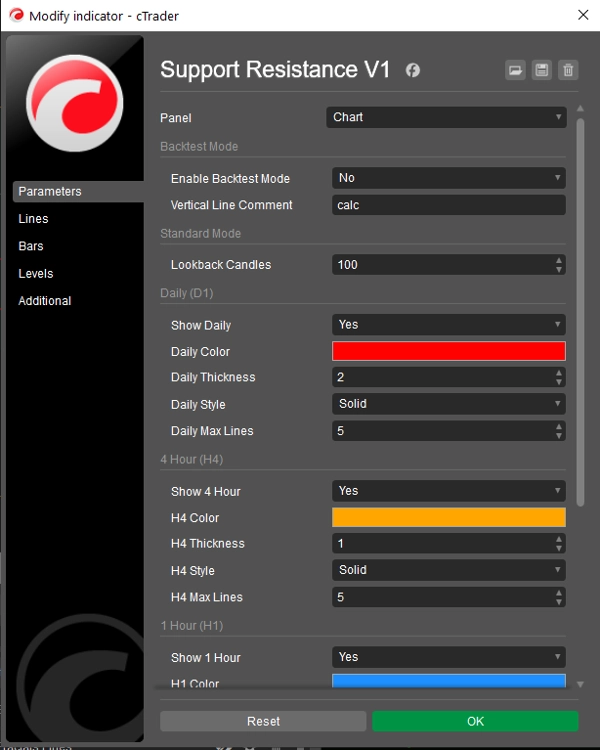
- 専用のバックテストモード:チャート上の特定の定義された時間範囲にインジケーターの分析を制限する機能を含みます。これは未来のバイアスなしに時間の進行をシミュレートし、正確な手動バックテストに不可欠です。
概要
AIによる概要
Frac Support Resistance V1 is a technical indicator designed to automatically calculate and display smart support and resistance lines derived from multiple timeframes: daily (D1), 4-hour (H4), hourly (H1), and 15-minute (M15). It assists traders who rely on market structure by visually highlighting critical price levels established on higher timeframes, reducing the need for manual identification.
Key features include customizable visual hierarchy, allowing independent adjustment of line thickness, style (solid, dashed, dotted), and color for each timeframe. This enables quick recognition of the relative strength of support and resistance levels. Users can also control chart clarity by setting maximum numbers of lines per timeframe to prioritize recent or major structural levels.
The indicator is based on fractal logic to identify genuine high and low pivots consistent with standard market structure analysis. It includes a dedicated backtesting mode that restricts analysis to a specified historical period, facilitating unbiased manual strategy testing by simulating real-time progression.
Frac Support Resistance V1 supports various markets including Forex, cryptocurrencies, commodities, indices, and stocks, with tags indicating compatibility with symbols like BTCUSD, EURUSD, GBPUSD, XAUUSD, NAS100, and USDJPY. The tool is suited for strategies involving breakout, scalping, smart money concepts, and grid trading.
インジケーターのプロフィール
カスタマーレビュー
5.0
レビュー: 1
5 | 100 % | |
4 | 0 % | |
3 | 0 % | |
2 | 0 % | |
1 | 0 % |
カスタマーレビュー
December 1, 2025
A small account test feels safer, and the plan becomes easier to stick with, and the chart still needs a final look.
ディスカッション
よくあるご質問
BTCUSD
Forex
Signal
Breakout
Indices
EURUSD
Commodities
GBPUSD
NZDUSD
Prop
Scalping
SMC
Crypto
Grid
Stocks
AI
XAUUSD
NAS100
USDJPY
cTrader Storeで入手可能な取引ボット、インジケーター、プラグインなどの商品は、第三者の開発者が提供するものであり、情報と技術の取得のみを目的としてご利用いただけます。cTrader Storeはブローカーではなく、投資助言や個人的な推奨を行うことも、将来のパフォーマンスを保証することもありません。
この作成者の他の商品


![「[Stellar Strategies] Market Session Ultimate」ロゴ](https://cdn.ctrader.com/image/webp/61ffd537-0125-4246-9e72-42eca1791d64_28232)


価格
登録日 14/01/2025
55
販売
11.5K
無料インストール